
Figure 1.
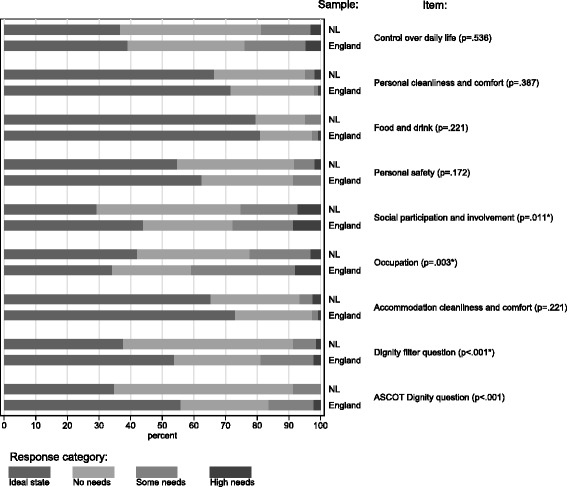
Response distributions ASCOT items in the Netherlands (NL) and England. Number of respondents NL = 169 (missing values between 0.6% and 10.7%); Number of respondents England = 152 (missing values between 0% and 5.9%)
Official websites use .gov
A
.gov website belongs to an official
government organization in the United States.
Secure .gov websites use HTTPS
A lock (
) or https:// means you've safely
connected to the .gov website. Share sensitive
information only on official, secure websites.
Response distributions ASCOT items in the Netherlands (NL) and England. Number of respondents NL = 169 (missing values between 0.6% and 10.7%); Number of respondents England = 152 (missing values between 0% and 5.9%)