
Figure 3.
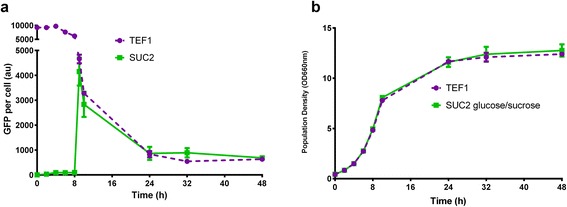
Comparison of TEF1 and SUC2 promoter strengths. GFP fluorescence (a) and population density (b) were measured for P TEF1-GFP and P SUC2-GFP expressing strains in 1% glucose, 1% sucrose containing medium over 48 hours. Mean and standard deviation for triplicate cultivations are shown.