
Figure 1.
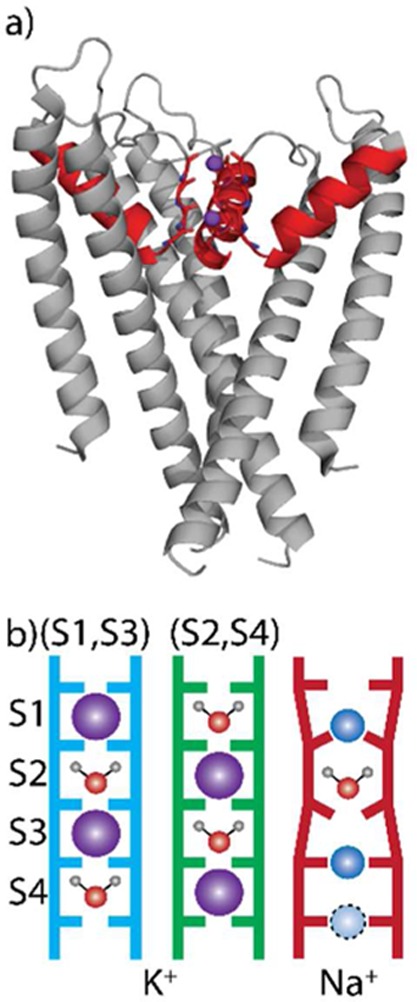
(a) Structure of the transmembrane region of KcsA highlighting the extended filter region (red) and K+ ions in the (S1, S3) configuration (purple). (b) Schematic illustration of the ion occupancy within the selectivity filter for the three configurations investigated.