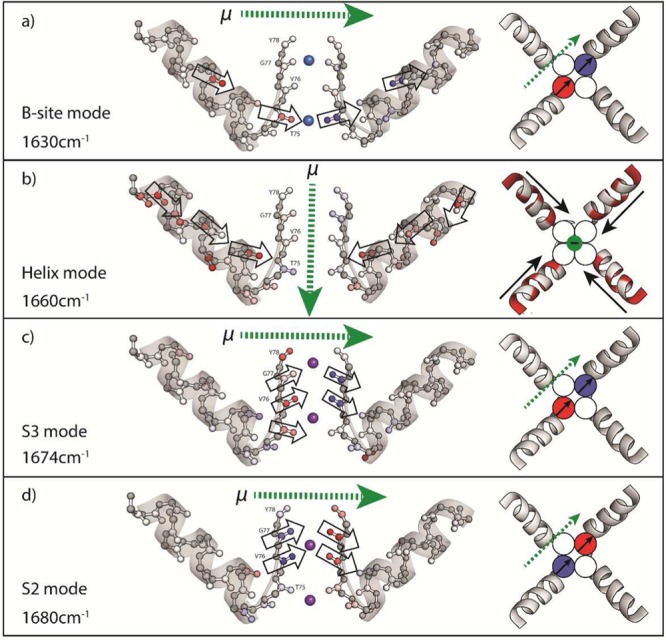
Figure 7.

Visualizations of calculated doorway modes of the extended filter region presented as side view (left) and top view looking down the pore (right). Color indicates the relative sign of the CO vibrational motion (contraction/extension), while the color intensity indicates its amplitude. Outlined arrows indicate the direction of the transition dipole moment of individual carbonyls contributing most to the mode. The sum of transition dipoles of one monomer is shown as black arrows. The direction of the net transition dipole moment for the whole extended monomer (μ) is shown with dotted green arrows. The colors in circles on the right indicate the overall displacement of the selectivity filter carbonyls in that strand. Na+ and K+ ions are blue and purple, respectively.
