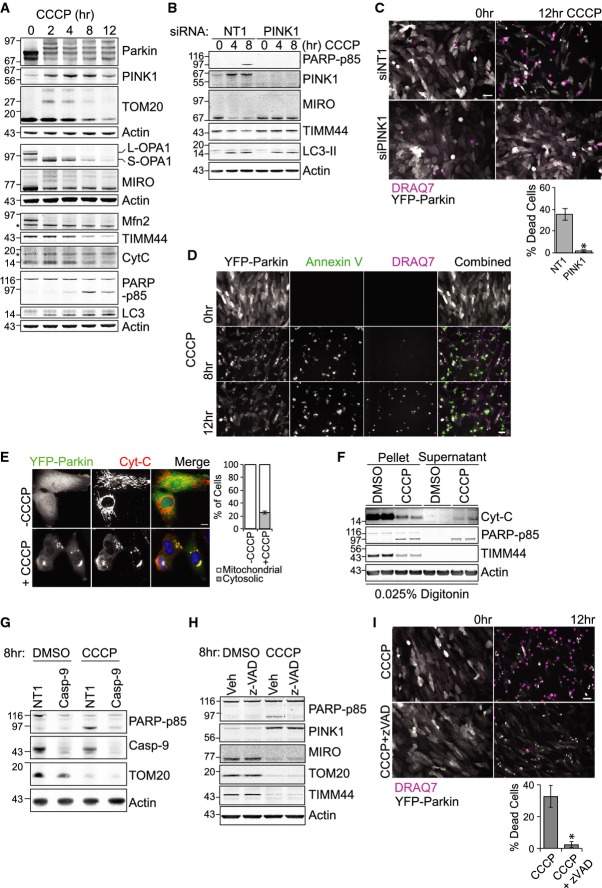
Figure 1. Parkin overexpression induces CCCP-dependent mitophagy and apoptotic cell death.
- A hTERT-RPE1-YFP-Parkin cells treated with CCCP (10 μM), harvested and probed as indicated. * indicates non-specific bands.
- B, C hTERT-RPE1-YFP-Parkin cells transfected with PINK1 or a non-targeting siRNA (NT1) for 72 h were treated with CCCP. (C) The progression of mitophagy was recorded by live-cell imaging in the presence of the membrane-impermeable dye DRAQ7 (pink). Single frames from a representative video (Supplementary Movie S1), YFP-Parkin (grey). Scale bar: 40 μm. Graph shows averaged data (% of DRAQ7-positive cells) from three independent experiments ± SD, two-tailed paired t-test, *P = 0.05.
- D hTERT-RPE1-YFP-Parkin cells were treated with CCCP and imaged at 15-min intervals in the presence of the membrane-impermeable dye DRAQ7 (pink) and Alexa Fluor 350-conjugated annexin V (green). Single frames from a representative video, YFP-Parkin (grey). Scale bar: 40 μm.
- E hTERT-RPE1-YFP-Parkin cells were treated with CCCP for 6 h, fixed and stained for Cyt-C. Cell with partially cytosolic Cyt-C staining is outlined. Scale bar: 10 μm. Graph shows percentage of cells with exclusively mitochondrial Cyt-C or partially cytosolic Cyt-C staining from three independent experiments ± SD.
- F hTERT-RPE1-YFP-Parkin cells were treated with CCCP for 6 h and then harvested for digitonin fractionation. Duplicate samples of pellet and supernatant fractions were loaded at 1:3 (V:V).
- G hTERT-RPE1-YFP-Parkin cells were transfected with NT1 or caspase 9 siRNA for 72 h and treated with CCCP for 8 h.
- H hTERT-RPE1-YFP-Parkin cells were treated with CCCP and z-VAD-FMK (20 μM) for 8 h.
- I hTERT-RPE1-YFP-Parkin cells treated as in (G) were imaged every 15 min in the presence of DRAQ7 (pink). Single frames from a representative video, YFP-Parkin (grey). Scale bar: 40 μm. Graph shows averaged data (% of DRAQ7-positive cells) from three independent experiments ± SD. Two-tailed paired t-test, *P = 0.05.
Source data are available online for this figure.

