
Figure 4. USP30 depletion sensitizes cells to BH3-mimetics.
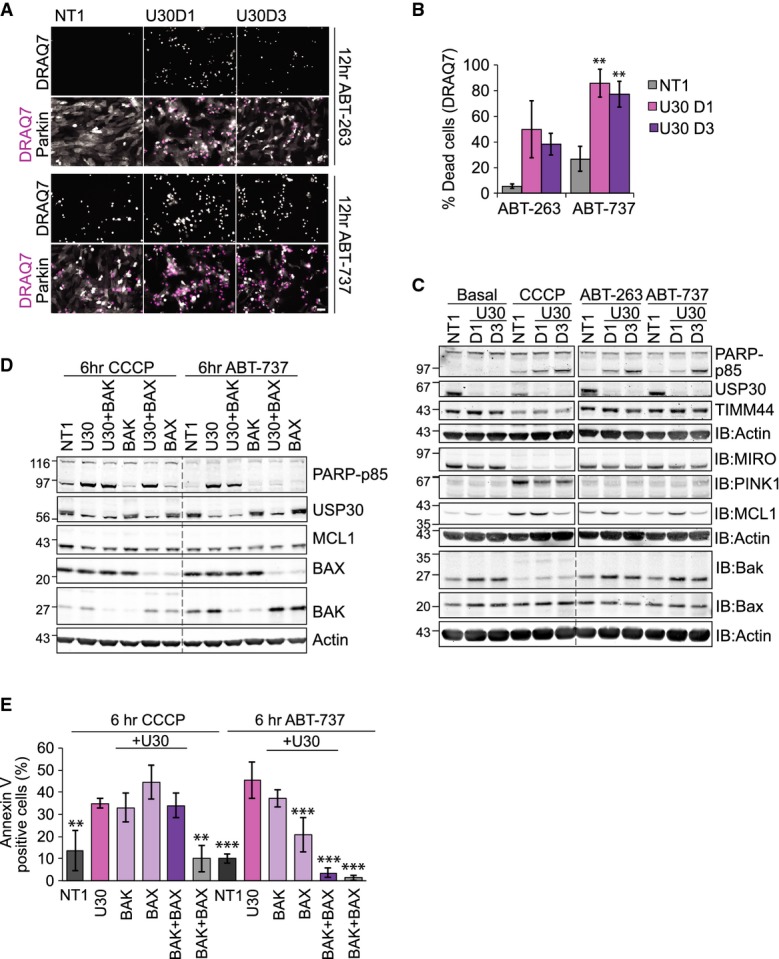
- hTERT-RPE1-YFP-Parkin cells were transfected for 72 h with NT1 or USP30 siRNA (D1 and D3) and then treated either with CCCP, ABT-263 or ABT-737 (all 10 μM). Cells were imaged at 30-min intervals in the presence of DRAQ7, and a single frame corresponding to the 12-h time point is shown (see also Supplementary Movies S3, S4 and S5). Top rows show the isolated DRAQ7 staining (dead cells in white on black). Bottom rows show YFP-Parkin in grey and DRAQ7 in pink. Scale bar: 40 μm.
- Graph shows the % of DRAQ7-positive cells after 12 h of treatment. ABT-263, 10 μM: n = 2, bars indicate range; ABT-737: n = 3 independent experiments, ± SD. One-way ANOVA and Dunnett's multiple comparison's test, **P = 0.01.
- Same transfection and drug treatment as in (A). Cells were harvested after 6 h of CCCP or 4 h of ABT-263 and ABT-737 treatment and samples probed as indicated.
- hTERT-RPE1-YFP-Parkin cells were transfected with NT1, or siRNAs targeting USP30 (D3), BAX and BAK for 72 h. Cells were treated with CCCP or ABT-737 for 6 h. Shown are samples from a representative experiment.
- hTERT-RPE1-YFP-Parkin cells were transfected with siRNAs as indicated and treated with CCCP or ABT-737. Cells were imaged at hourly intervals in the presence of Alexa Fluor 350-conjugated annexin V. Graph shows the % of annexin V-positive cells at the 6-h time point, n = 3 independent experiments, ± SD. One-way ANOVA, Dunnett's test, comparison of all conditions versus USP30 knockdown, **P = 0.01, ***P = 0.001.
Source data are available online for this figure.