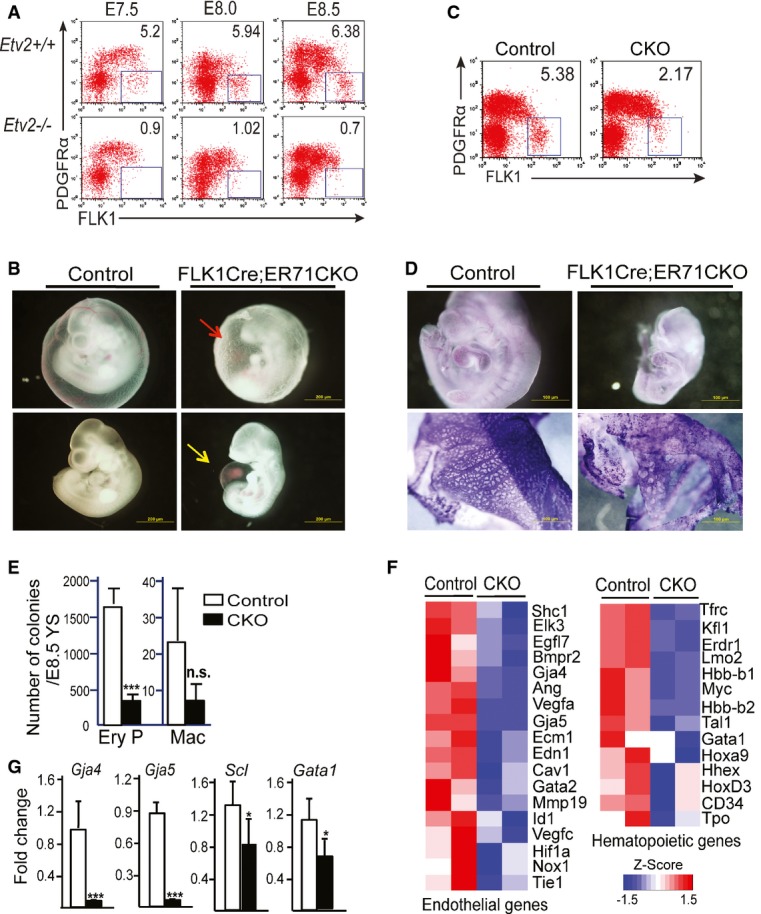
A Etv2+/+ and Etv2−/− yolk sac and embryo proper were analyzed for FLK1 and PDGFRα expression at E7.5, 8, and 8.5 (n = 6 for each). Representative FACS analysis at each time point is shown.
B Gross morphology of the E10.5 Flk1Cre;Etv2 CKO embryos is shown. Note the wrinkled yolk sac (red arrow) and the swollen pericardial cavity accumulated with fluid/blood (yellow arrow) in the mutants.
C FACS analysis of E8.5 Flk1Cre;Etv2 CKO embryos for FLK1 and PDGFRα expression.
D CD31/PECAM1 whole-mount staining of the E9.5 embryos (up: embryos; down: yolk sacs).
E Hematopoietic colony assay of the E8.5 wild-type and mutant yolk sacs. Mean ± SD, n = 4 biological replicates. ***P < 0.001, two-tailed Student's t-test.
F, G Microarray analysis (F) and qRT–PCR analysis (G) of the Flk1Cre;Etv2 CKO yolk sacs. Mean ± SD, n = 3 biological replicates. *P < 0.05, ***P < 0.001, two-tailed Student's t-test.

