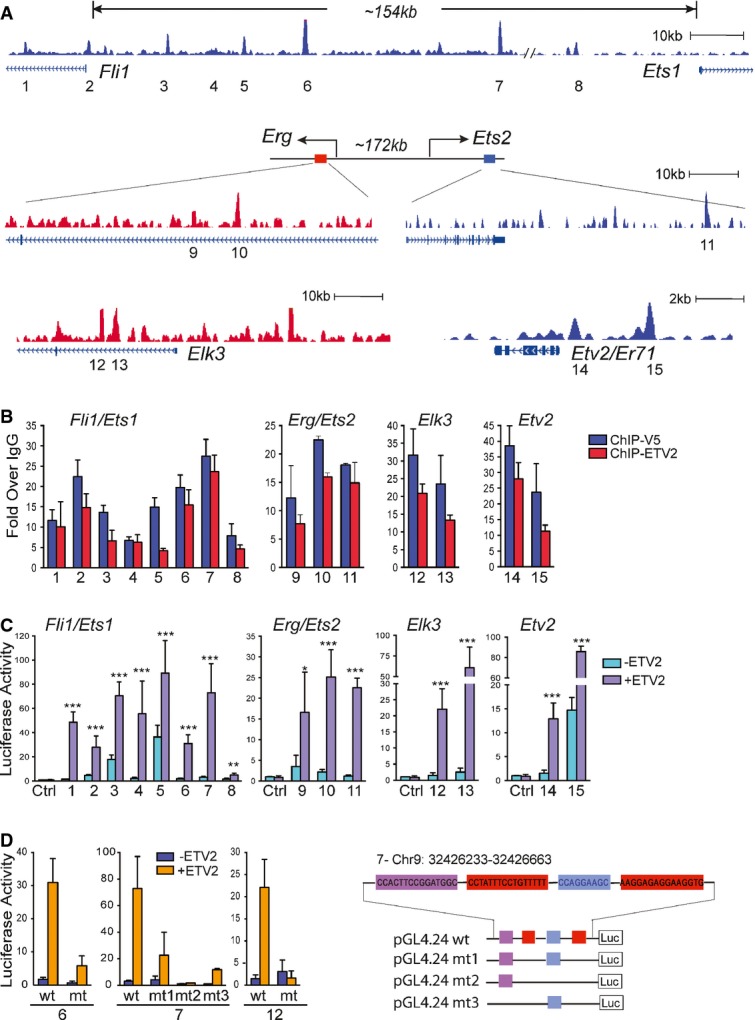
Figure 5. Ets genes are direct targets of ETV2.

- Genome browser views of the ETV2 binding peaks associated with Ets loci. Numbers (1–15) indicate ETV2 peaks.
- ETV2 enrichment at ETV2 peaks (1–15) by ChIP-qPCR analysis (mean ± SD, n = 4 biological replicates). PCR primers and genomic locations are provided in Supplementary Table S3.
- Luciferase reporter assay for 1–15 ETV2 peak regions from (A). Similar to Fig3C, the graph shows relative luciferase activity over reporter construct alone in the presence or absence of ETV2 expression plasmids (pMSCV-Etv2). Data are represented as mean + SEM. n = 4. *P < 0.05; **P < 0.01; ***P < 0.001, two-tailed Student's t-test.
- Luciferase reporter assay for the deletion mutants of the ETV2 motif in the selected peak regions (6, 7, and 12) is shown on the left (see Supplementary Table S3). Deletions of 2 (mt1, mt2) or 3 (mt3) ETV2 motifs within the peak 7 are shown on the right. Error bars represent the SEM obtained from four biological replicates.
