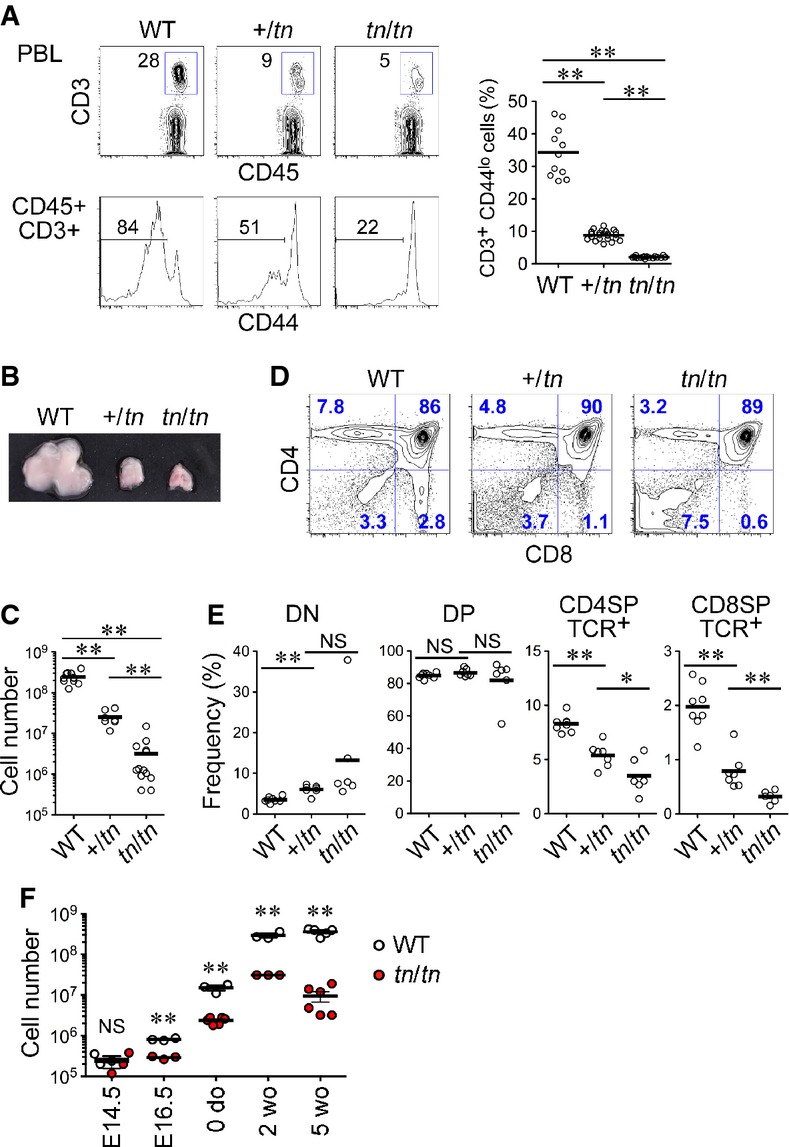
Figure 1. Thymus hypoplasia and impaired T-cell development in TN mice.

- Frequency of naïve T cells in peripheral blood leukocytes (PBL). PBL from wild-type (WT) (n = 11), +/tn (n = 22), or tn/tn (n = 16) mice were analyzed by flow cytometry for CD45, CD3ε, and CD44 (left). Numbers indicate percentage of cells within indicated areas. Graph indicates percentages of CD3+CD44lo naïve T cells in total CD45+ leukocytes (right).
- Representative photograph of thymi from 5-week-old mice.
- Total numbers of thymocytes from 5-week-old mice (n = 7–13).
- Flow cytometry profiles for CD4 and CD8 of total thymocytes from 5-week-old mice.
- Frequency of indicated thymocyte populations.
- Numbers of whole thymic cells prepared from indicated ages of WT (n = 3–5) or tn/tn (n = 3–6) mice.
Data information: Data represent more than three independent experiments. Each circle represents an individual mouse, and horizontal bars indicate the mean. The statistical significance between indicated groups was calculated with an unpaired one-tailed Student's t-test. *P < 0.05; **P < 0.01; NS, not significant.
