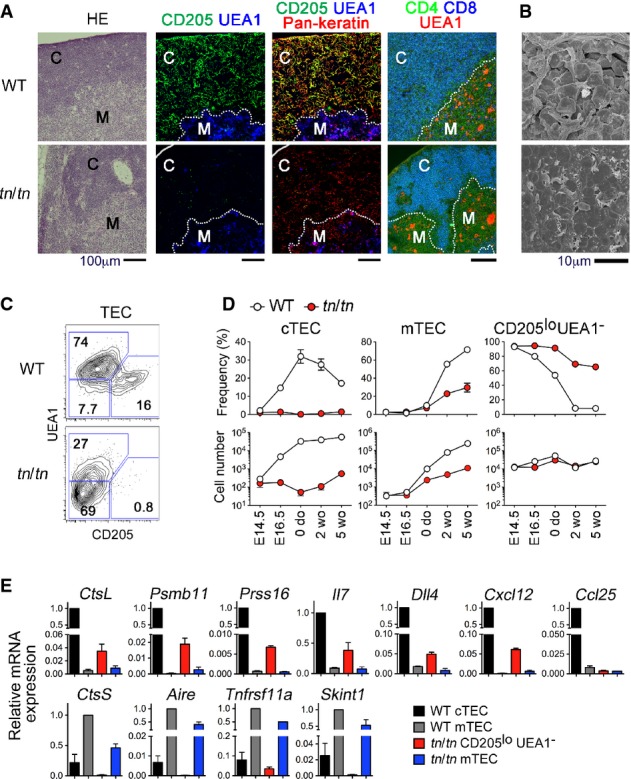
Figure 2. TN mice lack mature cTECs.

- Thymus sections from 5-week-old WT or tn/tn mice were stained with hematoxylin and eosin (HE), or for CD205, UEA1, pan-keratin, CD4, and CD8. “C” denotes cortex and “M” denotes medulla. Dotted lines indicate cortex/medulla boundary. Scale bars indicate 100 μm.
- Scanning electron micrographs of thymic cortex from WT or tn/tn mice. Scale bar indicates 10 μm.
- Flow cytometry profiles for CD205 and UEA1 of EpCAM+Keratin+ TECs prepared from 5-week-old WT or tn/tn mice.
- Frequency (% of EpCAM+Keratin+ cells) (top) and numbers (per mouse) (bottom) of CD205hiUEA1− (cTEC), CD205loUEA1+ (mTEC), or CD205loUEA1− TECs from the indicated ages of WT or tn/tn mice (n = 3–5, mean ± SEM).
- Quantitative RT–PCR analysis of the indicated genes in isolated TECs (n = 3, mean ± SE). mRNA expression was normalized to EpCAM mRNA, and those in WT cTECs or WT mTECs were arbitrarily set to 1.
Data information: Data represent more than three independent experiments (A, C, D, E) or one experiment with three mice per group (B).
