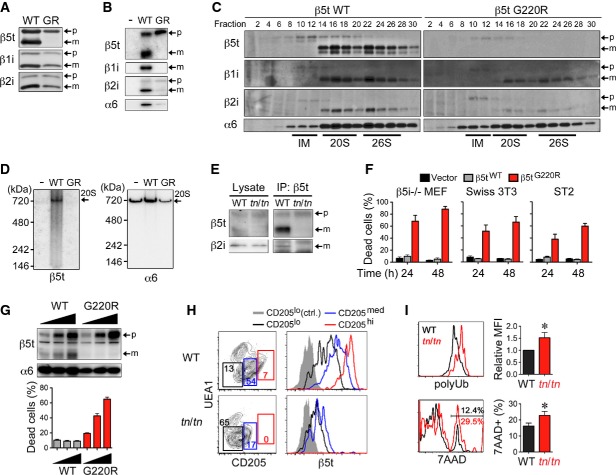
Figure 4. β5tG220R impairs proteasome assembly and cell survival in cTECs.
- A–D β5i−/− mouse embryonic fibroblasts (MEFs) were infected with retroviruses expressing C-terminally FLAG-tagged β5tWT or β5tG220R (GR) and treated with IFNγ. Forty hours after infection, total cell lysates (A) and immunoprecipitates with anti-FLAG antibody (B) were analyzed by immunoblotting. Cell lysates were fractionated by glycerol density gradient, and each fraction was used for immunoblotting and measurement of chymotrypsin-like proteasomal activity (C). Fractions 8–12, 14–18, and 22–26 contained assembly intermediates (IM), 20S proteasomes, and 26S proteasomes, respectively. Cell lysates were subjected to native PAGE followed by immunoblotting (D). Arrows indicate precursor (p) and mature (m) forms of β-subunits (A–C) or 20S proteasomes (20S) (D).
- E Cell lysates from E15.5 fetal thymus were immunoprecipitated with anti-β5t antibody followed by immunoblotting for β5t and β2i.
- F β5i−/− MEFs, Swiss 3T3 fibroblast cells, and ST2 bone marrow stromal cells were infected with retroviruses expressing β5tWT or β5tG220R or with empty retroviruses (Vector). β5i−/− MEFs were treated with IFNγ. Thirty hours after infection, EGFP+ cells were sorted and re-plated for additional culture for 24 or 48 h. Cells were detached and their viability was assessed by the trypan blue exclusion method (n = 3).
- G β5i−/− MEFs were retrovirally infected and treated with IFNγ. Thirty hours after infection, EGFPlo, EGFPmed, and EGFPhi cells were sorted and then immunoblotted for expression of β5t and α6 or re-plated for additional 24-h culture. Cell viability was assessed by the trypan blue exclusion method (n = 3).
- H Flow cytometry profiles for CD205 and UEA1 of gated EpCAM+Keratin+ TECs prepared from 1-week-old mice (left). Numbers indicate percentage of cells within indicated areas. Histograms show intracellular β5t expression in CD205lo (black), CD205med (blue), and CD205hi (red) cells and control staining of CD205lo cells (gray shaded).
- I Gated CD205med/hiUEA1− cTECs from E16.5 fetal thymus were further analyzed for cellular accumulation of polyubiquitinated proteins (polyUb) (top) and dead-cell staining by 7-aminoactinomycin D (7AAD) (bottom). Graphs show polyUb mean fluorescence intensity (MFI) and frequency of 7AAD+ dead cells (n = 3–5). The statistical significance was calculated with an unpaired one-tailed Student's t-test. *P < 0.05.
Data information: Data represent three (A–F, I) or two (G, H) independent experiments (error bars, SEM).

