
Figure 6. Reduced development of iNKT cells in TN mice.
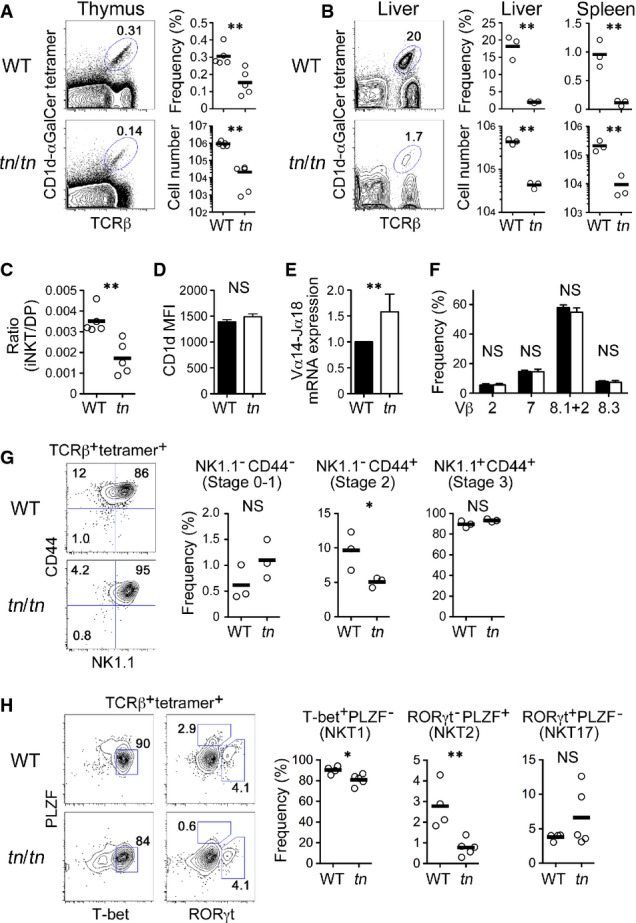
- A, B Thymocytes (A) or liver cells (B) from WT or tn/tn mice were stained with αGal-Cer/CD1d tetramer and anti-TCRβ antibody (left). The frequency and numbers of TCRβ+ αGal-Cer/CD1d tetramer+ cells from thymus (A), liver, or spleen (B) are shown (right) (n = 3–5).
- C The ratio of TCRβ+ tetramer+ iNKT cells to DP thymocytes (n = 5).
- D CD1d expression on DP thymocytes was equivalent between WT and tn/tn mice (n = 3–5).
- E DP thymocytes were isolated from WT or tn/tn mice and analyzed by quantitative RT–PCR (n = 3). The level of Vα14-Jα18 transcript was normalized to TCR-Cα mRNA, and those in WT were arbitrarily set to 1.
- F TCRβ+ tetramer+ thymic iNKT cells were further stained for Vβ2, Vβ7, Vβ8.1 + 2, or Vβ8.3 (n = 3–4).
- G TCRβ+ tetramer+ thymic iNKT cells were further stained for NK1.1 and CD44. Representative flow cytometry profiles (left) and the frequency among total iNKT cells (right) of NK1.1−CD44− (stage 0–1), NK1.1−CD44+ (stage 2), or NK1.1+CD44+ (stage 3) cells are shown (n = 3).
- H TCRβ+ tetramer+ thymic iNKT cells were intracellularly stained for PLZF, T-bet, and RORγt. Representative flow cytometry profiles (left) and the frequency among total iNKT cells (right) of T-bet+PLZF− (NKT1), RORγt−PLZF+ (NKT2), or RORγt+PLZF− (NKT17) cells are shown (WT, n = 4; tn/tn, n = 5).
Data information: Data represent more than three independent experiments. Each circle represents an individual mouse, and horizontal bars indicate the mean (A, B, C, G, H). Mean ± SEM (D, E, F). The statistical significance was calculated with an unpaired one-tailed Student's t-test. *P < 0.05; **P < 0.01; NS, not significant.