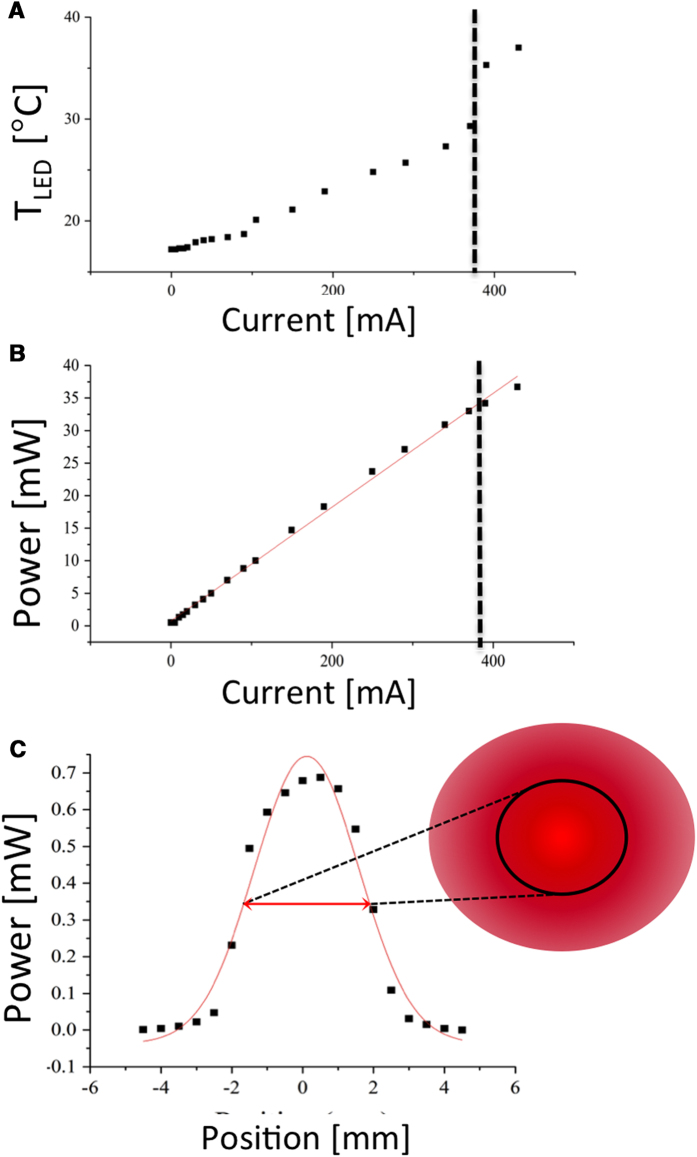
Figure 1. LED performance and thermal characterization.
OptoDiode LED temperature (A) and power output (B) versus operating current, showing linear dependence up to the onset of thermal performance loss near 400 mA. Both measurements were performed with heat sink in an unenclosed geometry and ambient laboratory temperature. LED beam profile (C) with Gaussian fit and its FWHM. To the right of the plot is a projected 2D representation of the LED beam and its associated FWHM.

