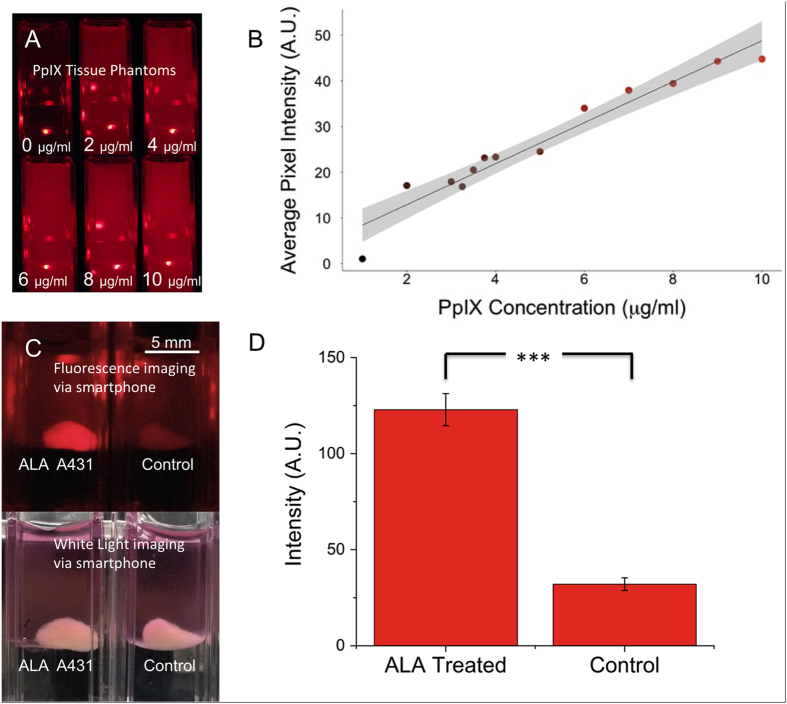
Figure 6. Smartphone-based quantitative PpIX fluorescence imaging in phantoms and A431 cell aggregates.
Fluorescence images (A) of physiologically relevant concentrations of PpIX in phantoms was imaged using the smartphone setup shown in Fig. 5. Analysis using a custom routine developed via MATLAB image processing toolbox used to calculate concentration-dependent fluorescent intensity (B) In (B) the linear dependence of fluorescence signal over is shown (R2 = 0.9391) and 95% confidence interval (grey shading) are shown in (C) ALA treated (left) and control (right) A431 aggregate samples, imaged with smart phone imaging setup (top) and with normal lab lighting (white light, bottom). The visual contrast between ALA-treated and untreated tissue becomes clear when imaged via fluorescence. (D) Differential PpIX fluorescence emission of control and ALA treated centimetre-sized A431 aggregates, obtained using the smartphone-imaging setup is highly significant (p < 10–7).

