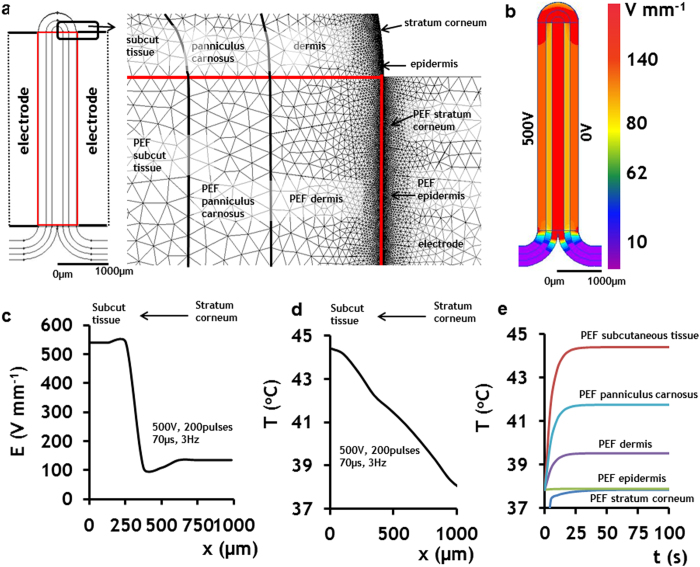
Figure 6. Electro-thermal model of PEF applied at the rat skin.
The figure shows the electro-thermal model when the applied PEF protocol was 500 V, 70 μs pulse duration, and 200 pulses delivered at 3 Hz. a Finite elements numerical model, and geometry and solved mesh of the rat skin with all major composing layers. The skin is divided into two regions: 1) untreated skin and 2) PEF-treated skin. PEF-treated skin layers are tagged with PEF sign. b 2D map of electric field distribution in the skin slice. c The simulated values of electric field strengths in various skin layers (right panel). d Final simulated temperature distribution immediately after PEF. e. Time-dependent temperature increase in various skin layers during PEF administration.

