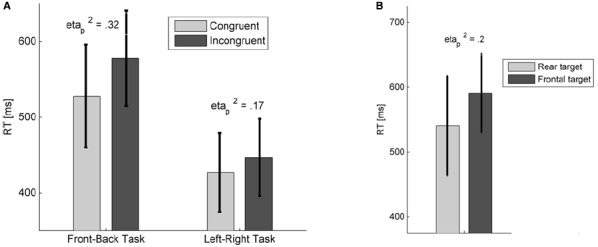
FIGURE 2.

(A) Mean RTs from both versions of the dot-probe task, for negative-neutral auditory cue pairs. Congruent trials are those when the negative auditory cue and the target were presented at the same location. Effect sizes and 95% confidence intervals were also shown. (B) Mean RTs for the same stimulus cue-pair trials in the front-back version of the task. Error bars indicate 95% confidence intervals.
