
Figure 14.
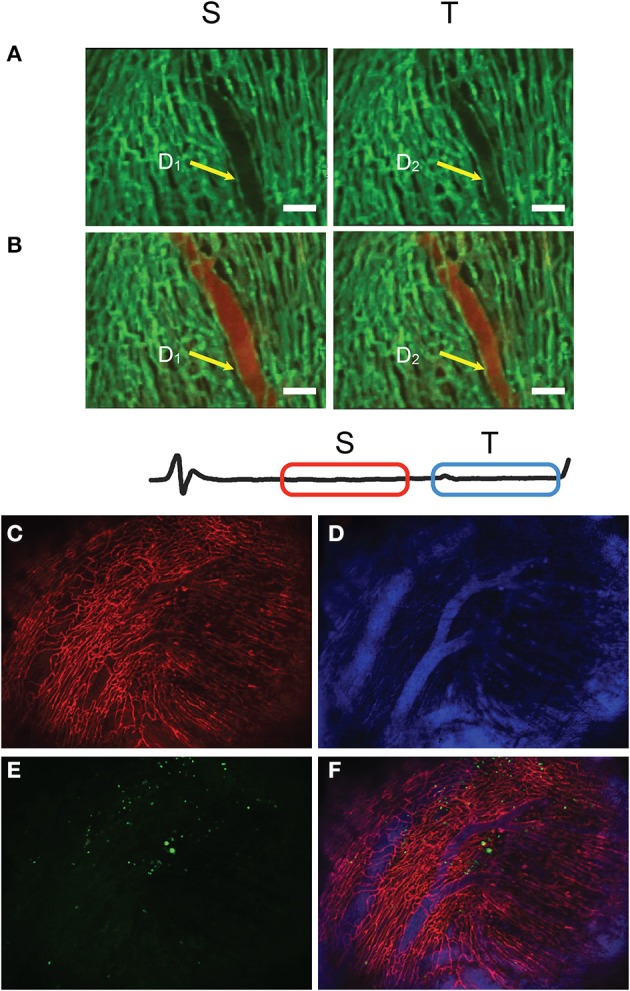
Time-lapse fluorescence imaging of heart perfusion using a vascular pool imaging agent injected via tail vain. Frames S and T are taken at two different time-gating windows within the ECG, corresponding to two distinct phases of the cardiac cycle. (A) Images taken before perfusion. (B) Images taken after perfusion. Changes in the vessel diameter are evident for the two phases. Green: fluorescent lectin staining of capillaries; red: fluorescent signal from the vascular pool agent Angiosense-680. (C–F) Large field of view images obtained with SSM of a heart which sustained an ischemia reperfusion injury before being injected with GFP-expressing cells, freshly isolated from the bone marrow of a donor mice. (C) Red represents the fluorescence lectin signal from stained capillaries; (D) blue the fluorescence signal produced by the blood pool imaging agent Angiosense-680; (E) green the GFP-expressing cells; (F) fusion of three images. Adapted from Lee et al. (2012a).