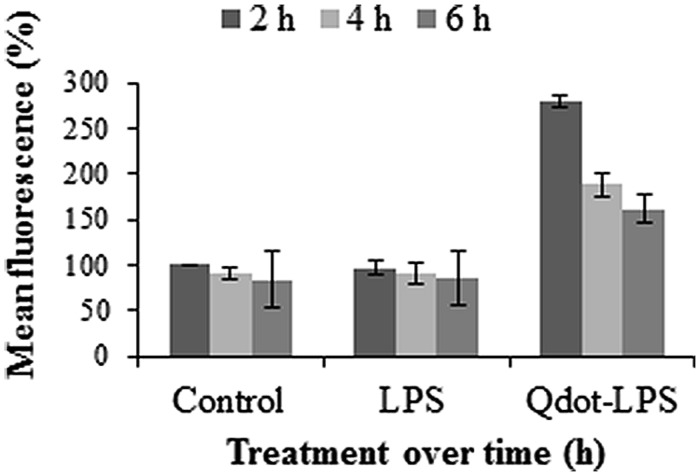
FIGURE 5.
Protoplast fluorescence changes over a 6 h incubation period following treatments with both unlabeled LPS (0.4 μg/ml LPSE. coli) and Qdot-LPS (0.46 μg/ml Qdot-LPSE. coli). Untreated Arabidopsis protoplasts were used as a control and set to a value of 100% (at 2 h) relative to which treated samples are reported. Three independent experiments were conducted and the error bars represent standard deviation.

