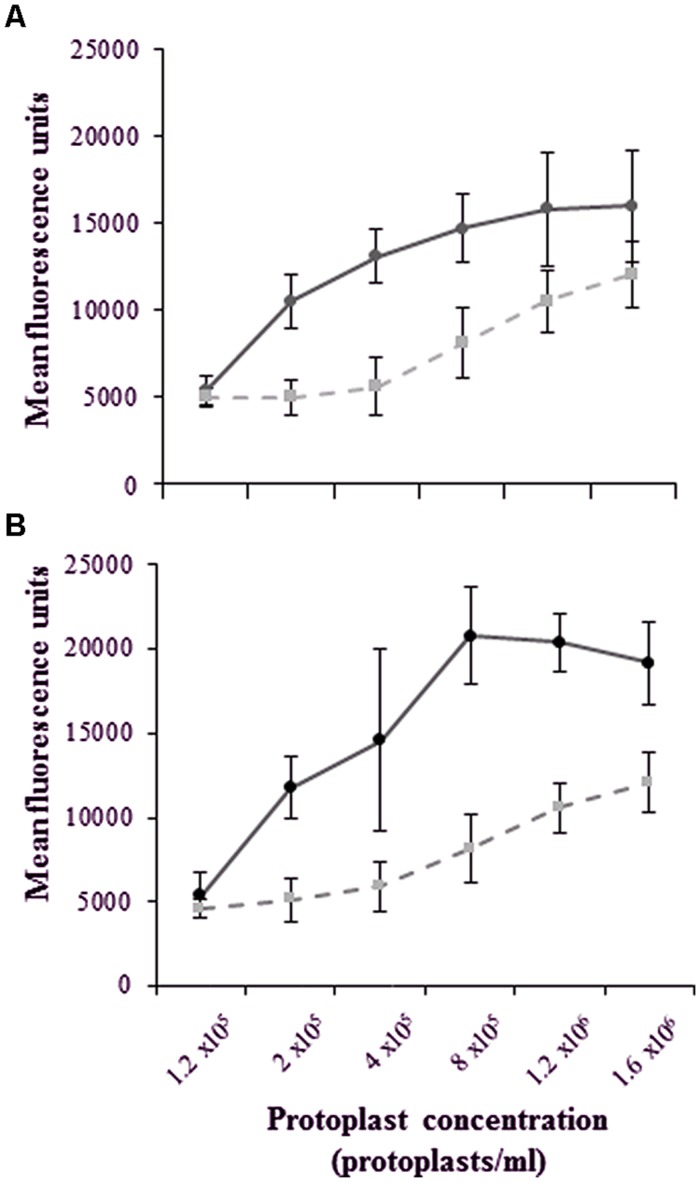
FIGURE 6.
Dose-dependent kinetics illustrating a plateau in the mean fluorescence even with an increase in the total number of binding sites on an increasing number of protoplasts following a 2 h treatment with (A) Alexa-LPSE. coli (measured at 500–560 nm) and (B) Qdot-LPSE. coli (measured at 590–630 nm). The unlabeled LPSE. coli-treated protoplasts as controls (dashed lines) are compared to treated protoplasts (solid lines), with the error bars representing the standard deviation of three independent experiments.

