Figure 2.

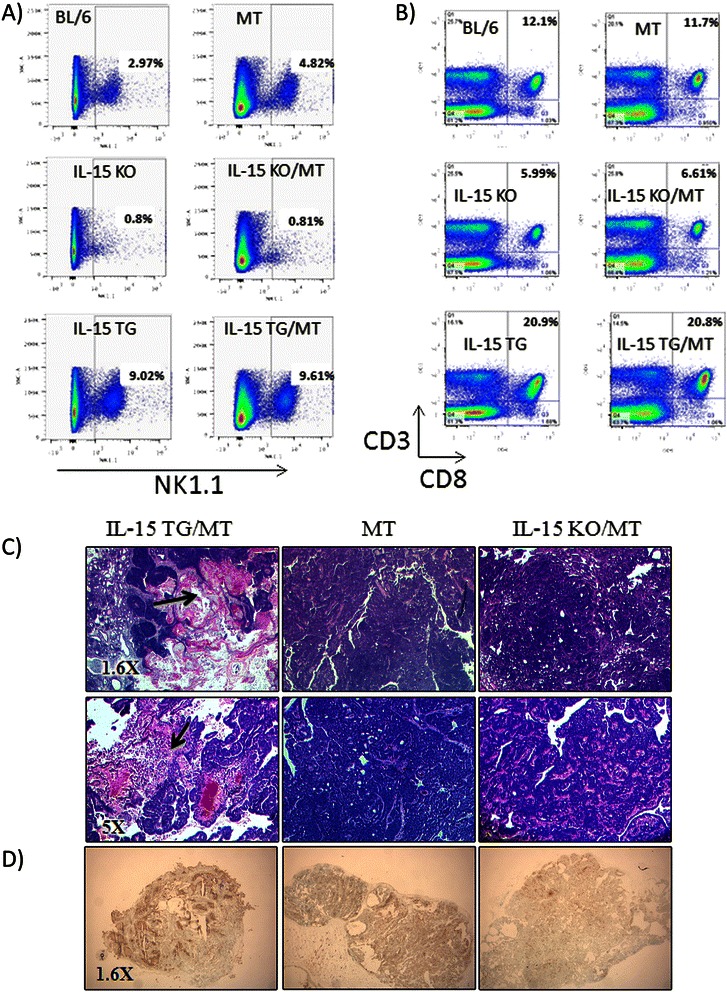
Impact of lack of IL-15 or overexpression of IL-15 on lymphocytes in the MT background and on tumor histology. (A & B) Spleens from 6-8 week old IL-15 KO, IL-15 KO/MT, BL/6, MT, IL-15 TG and IL-15 TG/MT were analyzed by flow cytometry for NK cells (A) and CD8 T cells (B) (representative of n = 3, IL-15 KO, BL/6 and IL-15 TG, n = 2 IL-15 KO/MT, MT and IL-15 TG/MT). Both IL-15 KO and IL-15 KO/MT mice have few NK cells and have reduced proportion of CD8 T cells. In contrast, IL-15 TG and IL-15 TG/MT mice both have an equal increase in NK cells and CD8 T cells proportions. (C) H&E staining of IL-15 KO/MT, MT and IL-15 TG/MT tumors. Representative images from n > 10 per group (1.6X and 5X). Arrows indicate areas of tumor destruction. (D) TUNEL stain (ApopTag In Situ Apoptosis Detection Kit- Millipore) on cryosections from representative IL-15 KO/MT, MT and IL-15 TG/MT tumors (n = 3/group) (Apoptosis = dark brown).
