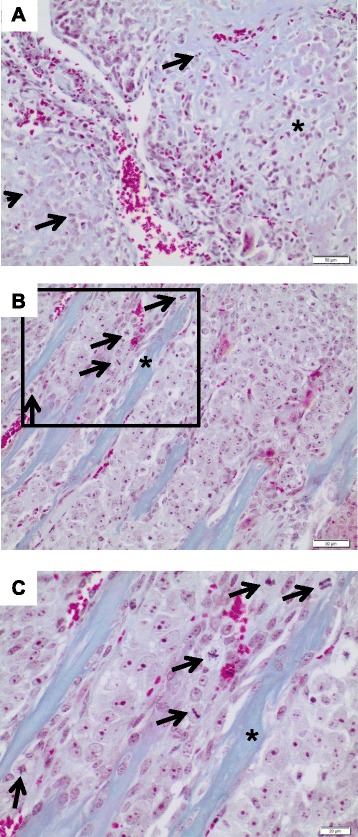
Figure 6.

Representative histology of the tumors (Masson trichrom staining). Note the intimate association of neoplastic disorganized, fairly primitive trabeculae (bluish color) with the tumor cells (light red cytoplasm), which either present as lace-like pattern A) or as broad sheets B). The arrows indicate mitosis, (*) indicates neoplastic osteoid. A): Relapsed primary osteosarcoma at the time of diagnosis (×20), B): corresponding patient-derived xenograft of mouse passage P3 (×20). As depicted here, the xenograft tumor closely resembles the relapsed primary including the production of neoplastic bone. Note the abundant mitotic tumor cells (arrows). C): Corresponding patient-derived xenograft of mouse passage P3 at higher magnification (framed detail from B; ×40).
