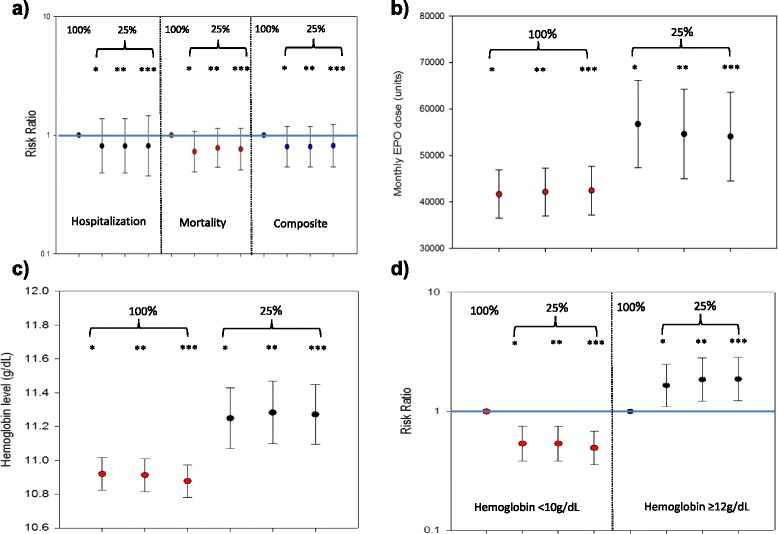
Figure 2.

The effect of dialysis facility opt-in status on outcomes. A. Hospitalization, mortality, and their composite. B. Monthly EPO dose. C. Hb concentration. D. Percentage of patients with Hb <10 and >=12 g/dL. *Unadjusted; **Adjusted for race (mortality), insurance (EPO dose, Hb outcomes); ***Adjusted for insurance, race, age, sex, and time on dialysis. EPO, epoetin alfa; Hb, hemoglobin. Bars represent 95% confidence intervals.
