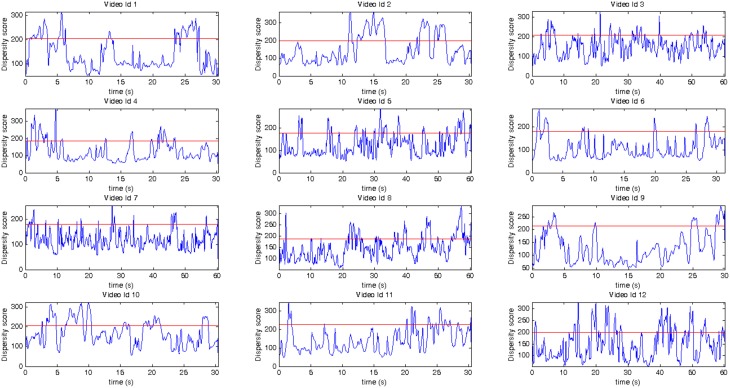
Figure 3.
Each plot corresponds to the Dispersion Score for each video across time, video id correspond to those listed in 1. Vertical axis: dispersion scores calculated across the two viewings of a video. Horizontal axis: Time in seconds for each video. The red horizontal line corresponds to the disparity score decision rule boundary (i.e., time intervals whose dispersion scores above the red line are classified as distracting).

