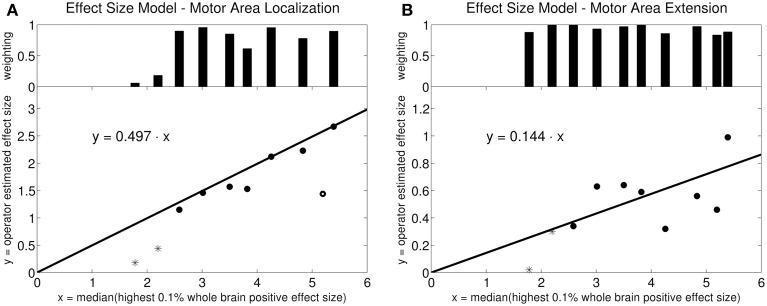
Figure 2.
Linear model for effect size estimation: Intercept-free robust linear regression of the estimated effect size against the median effect size of the 0.1% highest activation-signal amplitude voxels of the whole brain. The weighting on each data point in the robust fit is plotted in the bar diagram at the top. (A) Motor area localization: one point was weighted with zero by the robust fit algorithm (circle). The other points were weighted between 0.06 and 1.0. The starred points mark the two outliers in the data set (volunteers 9 and 10). (B) Motor area extension: the points were weighted between 0.84 and 1.0. The robust algorithm did not exclude any points as outliers. The starred points mark the two outliers in the data set (volunteers 9 and 10).

