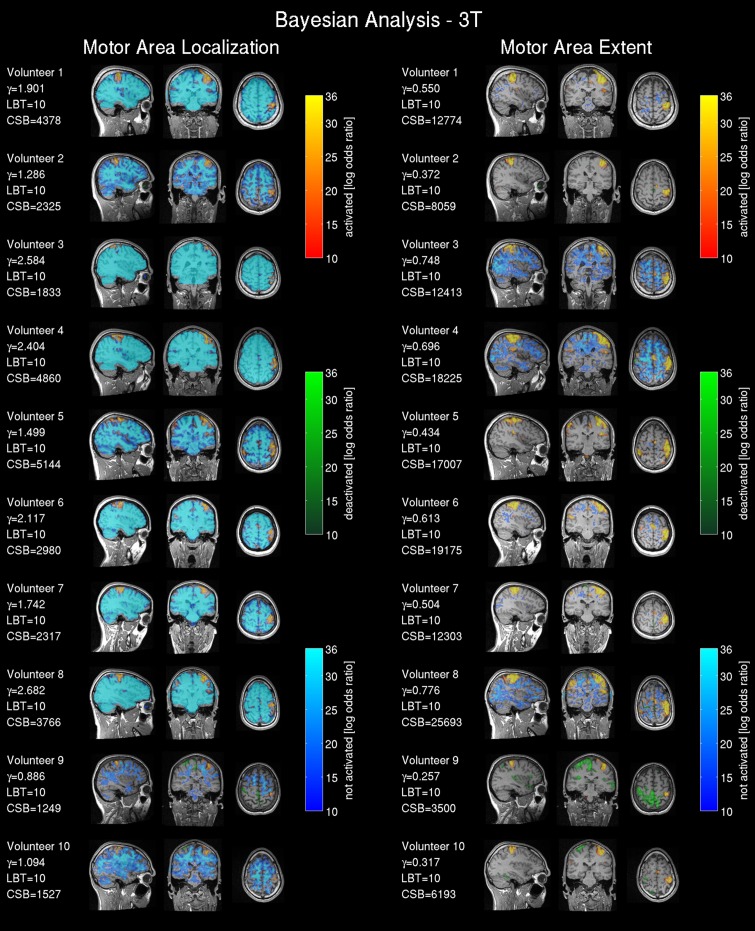
Figure 4.
Bayesian analysis for the 3T pre-operative scanner: Log Bayes factor maps showing the activation pattern and strength expressed by the voxel-wise log Bayes factor. The left side shows the activity maps using the effect size threshold γloc revealing the central motor area localization; on the right side the effect size threshold γex revealing the motor area extent. The maps are labeled as activated=positive BOLD response, deactivated=negative BOLD response and non-activated = no changes in the BOLD contrast, non-colored = low-confidence, i.e., BOLD activation status cannot be determined based on data. The effect size threshold (γ) calculated with the proposed linear model and the cluster size in voxels extracted from the Bayesian analysis (CSB) are displayed. Results from volunteers 9 and 10 are considered as outliers due to data quality problems.

