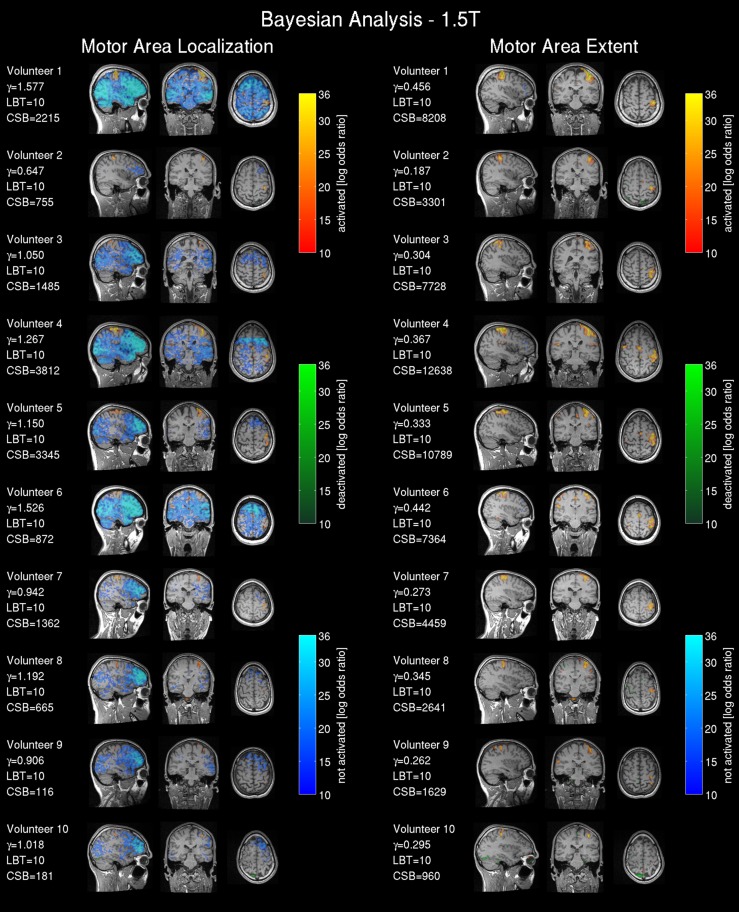
Figure 7.
Bayesian analysis for the 1.5T intra-operative scanner (similarly labeled to Figure 4): Bayesian analysis log Bayes factor maps showing the activation pattern and strength expressed by the voxel-wise log Bayes factor. The effect size threshold (γ) calculated with the proposed linear effect size model and the cluster size in voxels extracted from the Bayesian analysis (CSB) are displayed.

