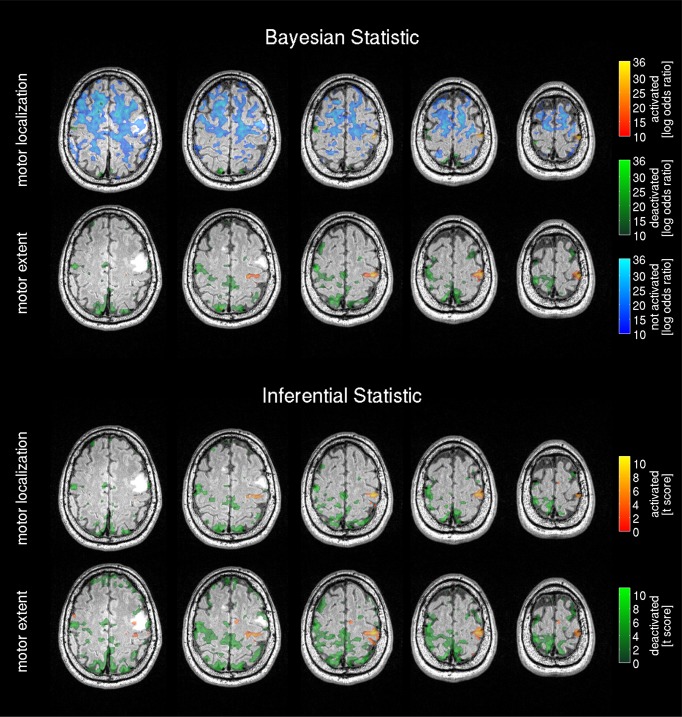
Figure 9.
Bayesian analysis and frequentist analysis results of the patient data: The Bayesian analysis for the tumor patient data shows the activation pattern and strength expressed by the voxel-wise log Bayes factor (similarly labeled to Figure 4). The activated motor region matches the respective area in the frequentist statistics results.

