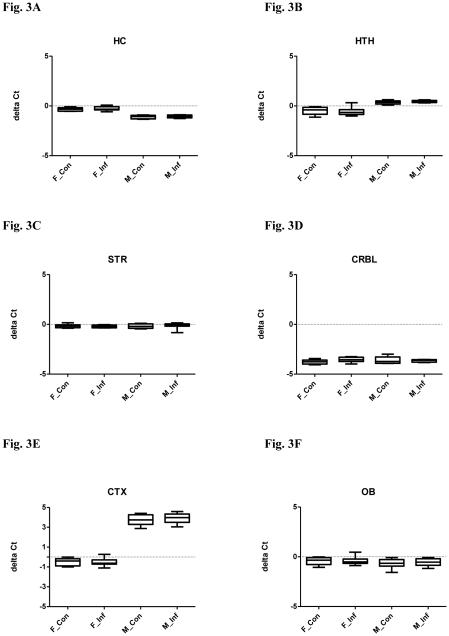
Figure 3.
Relative miR-195 expression in selected brain regions in both male and female mice with or without chronic T. gondii infection using qPCR. The box and whisker plot represents the delta Ct distribution: the bottom and top of the box are the first and third quartiles, and the band inside the box is the median. The ends of the whiskers represent the minimum and maximum values of the data. X axis represents the different experimental groups: F_Con (female control), F_Inf (female infection), M_Con (male control), and M_Inf (male infection). miR-195 expression was normalized to snoRNA135 and is given as delta Ct value, with lower values representing higher expression levels. (A) hippocampus (HC); (B) hypothalamus (HTH); (C) striatum (STR); (D) cerebellum (CRBL); (E) cortex (CTX) and (F) olfactory bulb (OB).

