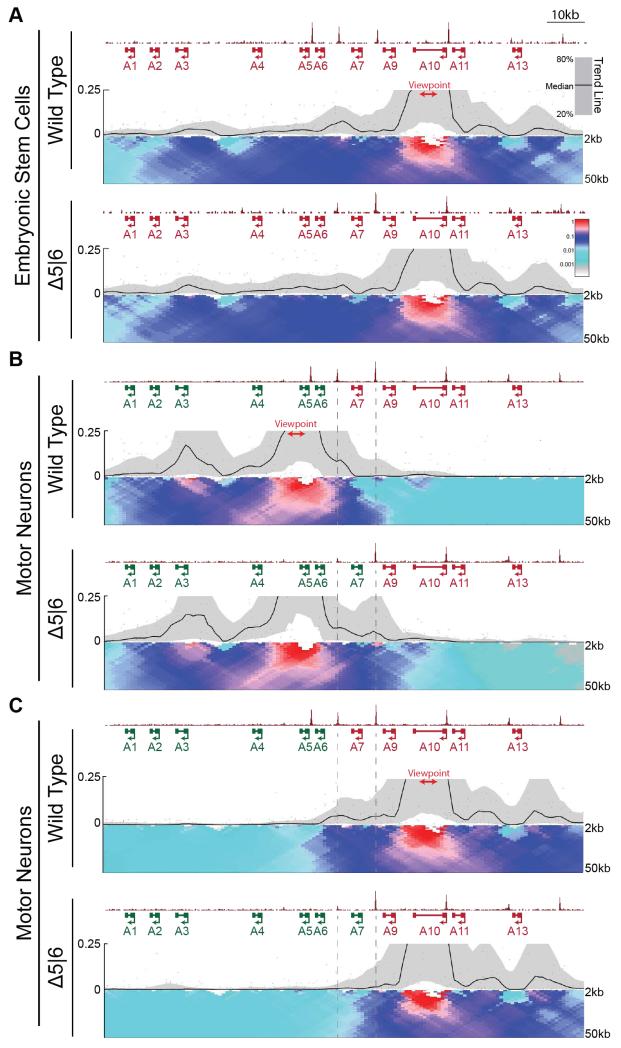
Fig. 3. Loss of CTCF alters topological architecture of the HoxA locus.
A,B. Normalized ChIP-seq read densities for CTCF and 4C contact profiles in WT and Δ5|6 ESCs (A) and MNs (B,C) using a viewpoint (red) in either the rostral (B, 4C.Hoxa5-A), or caudal (A,C, 4C.Hoxa10) segment of the cluster. ChIP signal is merged across two biological replicates, and 4C signal across three replicates. The median and 20th/80th percentile of sliding 5kb windows determine the main trendline. Color scale represents enrichment relative to the maximum attainable 12-kb median value. Dotted lines highlight the region between C6|7 and C7|9.

