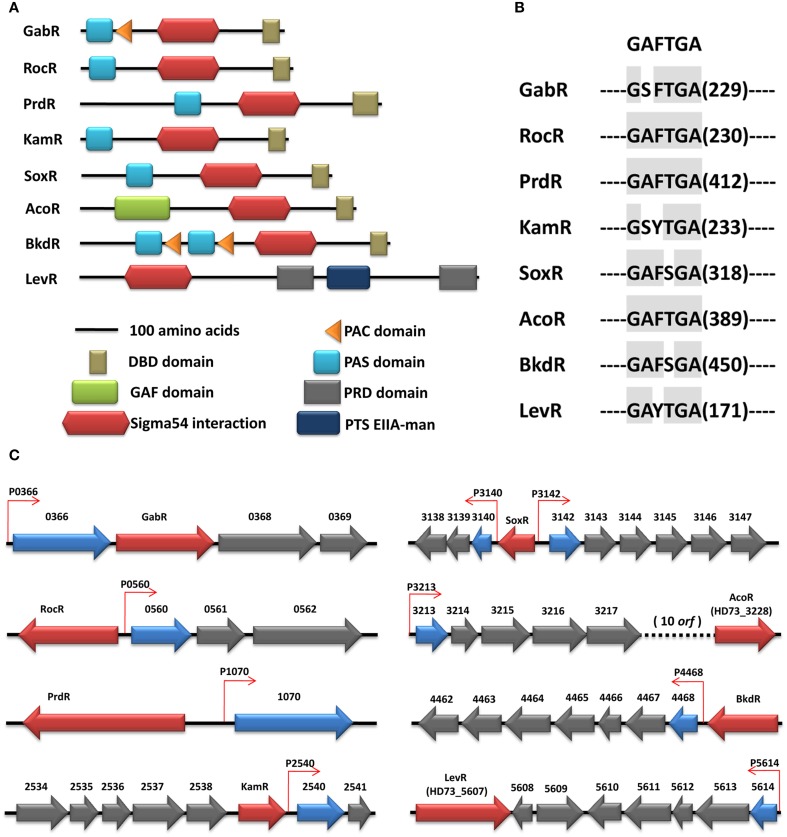
Figure 3.
(A) Domain structure of the EBPs in the Bt HD73 genome. The type of domains is indicated. All proteins are drawn at the scale indicated. (B) Conserved domain of the EBPs. The number indicates the distance between the conserved domain relative to the first amino acid. (C) Chromosomal context of EBPs in the Bt HD73 genome. The chromosomal context of those EBPs which have an associated σ54 promoter is shown here. Genes encoding EBPs are colored in red, whereas the genes or the first gene of the operons controlled by σ54 are represented in blue. The −12/−24 promoters are represented as small arrows and colored in red.

