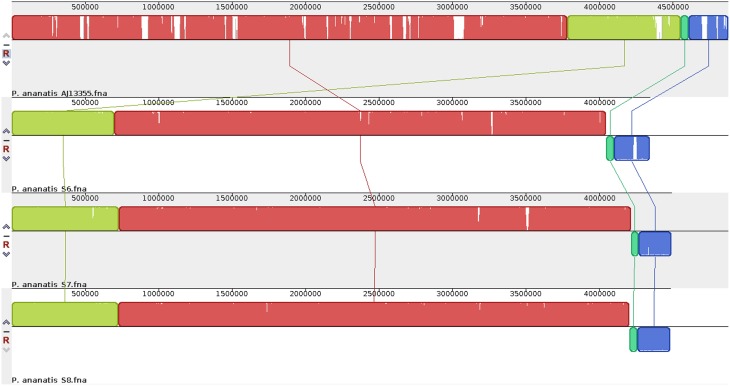
Figure 1.
Genome-scale comparison for draft genome sequences of the three P. ananatis strains (S6, S7, and S8) and complete genome sequence of P. ananatis AJ13355. Homologous DNA regions among the strains are marked by the same colored blocks, while gaps correspond to non-homologous regions. The figure was generated using nucleotide sequences of the genomes using Mauve v2.3.1.

