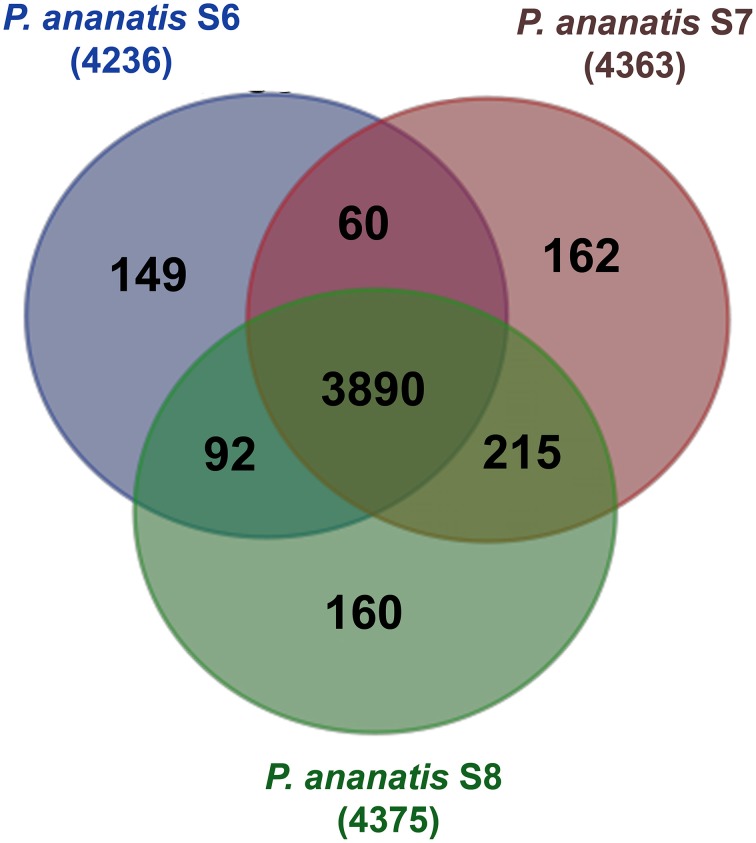
Figure 5.
Venn diagram of OrthoMCL cluster distribution across three P. ananatis S6, S7, and S8 strains identified by OrthoMCL. The number of core proteome clusters, gene families shared between the species and the specific proteins for each strain is indicated in each of the components. The numbers outside the Venn diagram show the total number of genes (in parentheses) for each strain.

