Table 1A.
Percentages of most abundant patterns in non-replicating cells with 3 spots (column I and II) and in replicating cells with 4 spots that have a replicated origin (O; column III–V).
| Strains | Total number cells with spots (mean cell length, μm) | Number cells with 3 spots (% of total population) | Non-replicating cells. % of 3-spot cells (mean cell length, μm) | nr. cells with 4 spots (% of total population) | Replicating cells with only the origin (O) duplicated. % of 4-spot cells (mean cell length, μm) | nr cells with 5 spots (% of total population) | ||||
|---|---|---|---|---|---|---|---|---|---|---|
| I LOR | II OLR/ORL | III-A LOOR | III-B OOLR/OORL | IV OLOR/OLOR | V OLRO | |||||
 |
 |
 |
 |
 |
 |
|||||
4056a
|
1376 (3.27) | 527 (33) | 62 (2.61) | 38 (2.56) | 63 (5) | 35 (3.27) | 6 (2.65) | 40 (3.04) | 19 (2.89) | 80 (6) |
4057a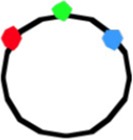
|
1099 (3.30) | 487 (44) | 74 (2.75) | 26 (2.63) | 138 (13) | 32 (3.21) | 9 (3.11) | 42 (3.21) | 15 (3.17) | 56 (5) |
4035b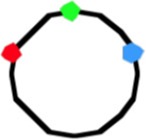
|
1003 (2.55) | 384 (38) | 77 (2.07) | 23 (2.57) | 129 (13) | 36 (2.27) | 1 (2.31) | 36 (2.33) | 26 (2.36) | 48 (5) |
4058a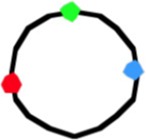
|
1166 (3.04) | 617 (53) | 78 (2.61) | 22 (2.54) | 191 (16) | 44 (3.03) | 8 (2.88) | 35 (3.14) | 13 (3.25) | 33 (3) |
4059a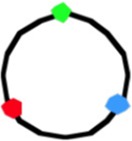
|
705 (3.09) | 448 (64) | 46 (2.75) | 54 (2.80) | 56 (8) | 43 (3.16) | 7 (2.75) | 32 (3.48) | 20 (3.38) | 41 (6) |
4060a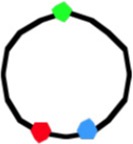
|
989 (2.98) | 306 (31) | 50 (2.49) | 50 (2.37) | 412 (42) | 14 (2.92) | 11 (2.83) | 43 (2.88) | 32 (3.17) | 85 (9) |
The average cell length (μm) in each subpopulation is given within brackets.
Cells grown at 32°C; doubling time Td = ~150 min.
Cells grown at 28°C (Td = 180 min) showing smaller cell lengths (see Materials and Methods).
