
Table 1B.
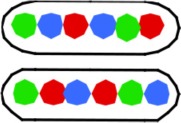
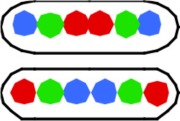
Percentages of most abundant patterns of 6 spots in cells with replicating or replicated chromosomes of the different constructs (see Figure 1A).
| Strains | Number cells with 6 spots (mean cell length, μm) | % of total population | Percentage of 6-spot patterns | |||||
|---|---|---|---|---|---|---|---|---|
| VI ORL ROL/OLR LOR | VII OLR LRO | VIII LOR LOR | IX LOR RLO/ROL LRO | X ROL LOR/LOR ROL | Other combi-nations (% of total population) | |||
 |
 |
 |
 |
 |
||||
4056a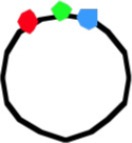
|
603 (3.80) | 44 | 20 (3.85) | 5 (3.64) | 22 (3.92) | 10 (3.67) | 9 (3.96) | 34 (2) |
4057a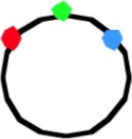
|
318 (4.04) | 29 | 27 (4.11) | 4 (3.92) | 28 (4.19) | 8 (3.99) | 8 (4.04) | 25 (2) |
4035b
|
412 (3.02) | 41 | 23 (2.89) | 7 (2.79) | 22 (3.23) | 17 (3.02) | 15 (3.10) | 16 (2) |
4058a
|
243 (3.89) | 21 | 28 (3.82) | 7 (3.60) | 24 (4.07) | 14 (3.88) | 10 (4.31) | 17 (2) |
4059a
|
120 (3.97) | 17 | 15 (4.05) | 5 (3.75) | 15 (3.82) | 12 (4.16) | 7 (4.14) | 46 (7) |
4060a
|
132 (3.85) | 13 | 32 (4.05) | 21 (3.66) | 11 (4.24) | 12 (4.01) | 0 | 24 (2) |
The average cell length (μm) in each subpopulation is given within brackets.
a
Cells grown at 32°C; doubling time Td = ~150 min.
b
Cells grown at 28°C (Td = 180 min) showing smaller cell lengths (see Materials and Methods.