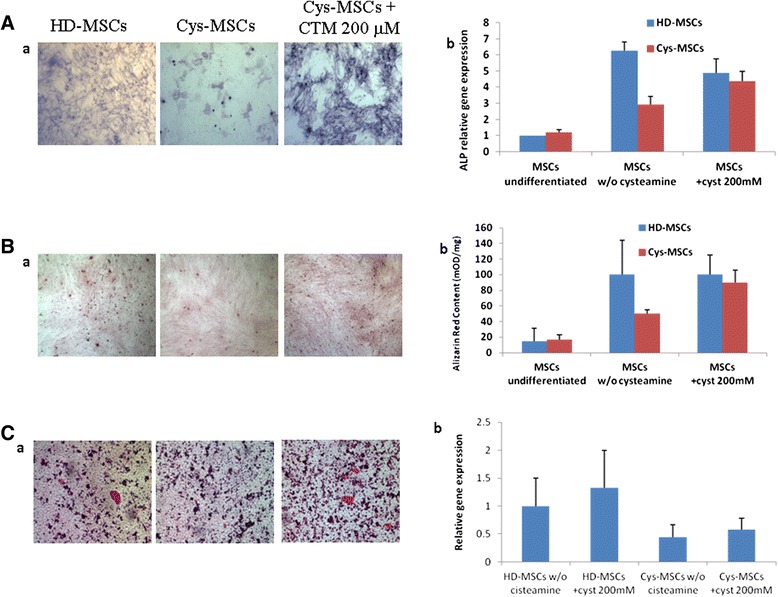
Figure 3.

Osteogenic differentiation capacity of HD- and Cys-MSCs. A: a) alkaline phosphatase (ALP) staining of Cys-MSCs as compared with HD-MSCs, in the absence and in the presence of cysteamine (CTM 200 μM). A: b) Quantitative Reverse Transcriptase Polymerase Chain Reaction (qRT-PCR) for ALP in HD- and Cys-MSCs in the absence and in the presence of CTM. B: a) Alzarine Red staining of Cys-MSCs as compared with HD-MSCs, in the absence and in the presence of CTM. B: b) Quantification of Alzarin Red staining in HD- and Cys-MSCs by spectrophotometry. The amount of Alzarin Red is related to the amount of DNA extracted from the same wells and is expressed in mOD/min/μg. Each bar represents the mean +/−SD of three experiments. C: a) Von Kossa staining of Cys-MSCs as compared with HD-MSCs, in the absence and in the presence of CTM. C:, b) qRT-PCR for collagen type 1 in HD- and Cys-MSCs in the absence and in the presence of CTM. The relative quantification of the gene expression was determined normalizing the data of the gene to GAPDH housekeeping gene and using the 2 –ΔΔCT method.
