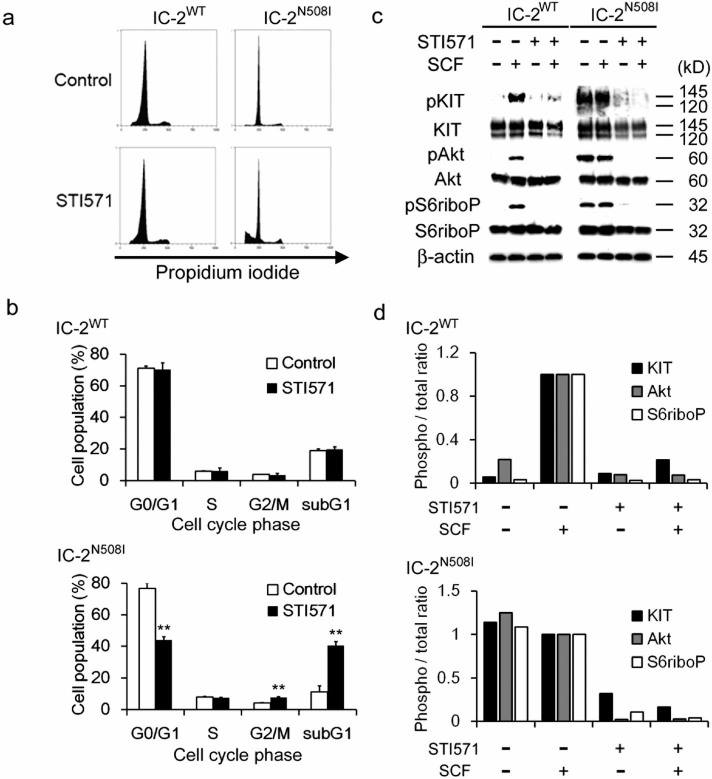
Figure 2. STI571 sensitivity and PI3K signaling activity in IC-2N508I cells.
(a, b) representative cell cycle analysis data and distribution of cells in each cell cycle phase as a function of STI571 treatment. Each subline was serum-starved overnight and then cultured with or without 250 nM STI571 for 24 h. After incubation, cells were fixed with 70% ethanol and stained with propidium iodide. Each data point represents the mean ± SD of 3 independent experiments with duplication. ** p > 0.01, relative to untreated control cells. (c) western blot analysis of each IC-2 subline and (d) quantification of the ratio of phosphorylated/total amounts of each protein. Cells were serum-starved overnight, cultured for 4 h in the presence or absence of 10 ng/mL SCF and/or 250 nM STI571, and expression of the indicated proteins was analyzed in western blots. The phosphorylated/total ratios of cells cultured in the presence of SCF were set to 1.

