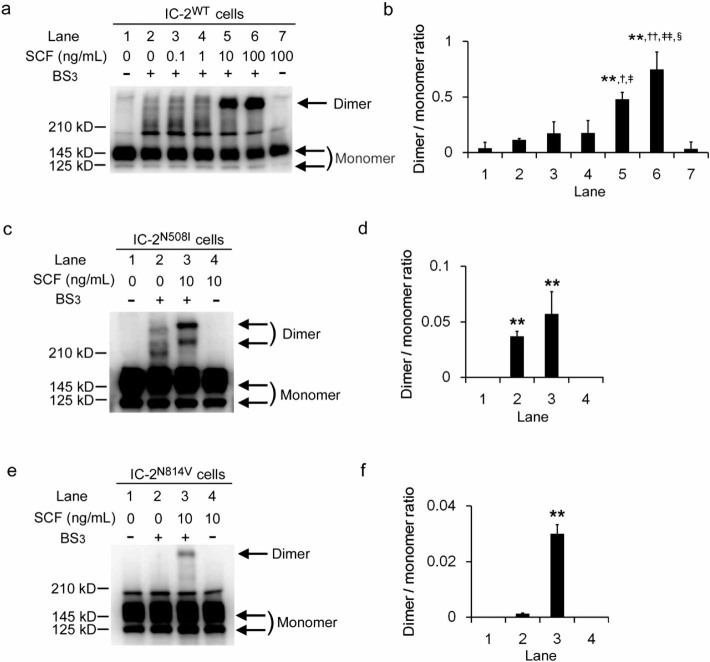
Figure 3. KIT dimerization in IC-2 sublines.
(a) western blot analysis of IC-2WT cells for KIT. Cells were treated with indicated concentrations of SCF, followed by the BS3 crosslinker (1 mM). (b) the mean dimer/monomer ratios ± SD of KIT observed in 3 independent experiments are indicated. Lane numbers correspond to those shown in Figure 3a. Arrows indicate monomeric or dimeric forms of KIT. **, p > 0.01 compared to lane 2; , †, ††, p > 0.05, 0.01 compared to lane 3; , ‡, ‡‡, p > 0.05, 0.01 compared to lane 4; and §, p > 0.01 compared to lane 5, respectively. (c, e) western blot analysis of IC-2N508I cells (c) and IC-2N814V cells for KIT (e). Cells were treated with the indicated concentrations of SCF and/or 1 mM BS3. Arrows indicate monomeric or dimeric KIT. (d, f) the mean dimer/monomer ratios ± SD of KIT from 3 independent experiments are shown. Lane numbers correspond to those shown in Figure 3c and e, respectively. ** p > 0.01 compared to lane 1.

