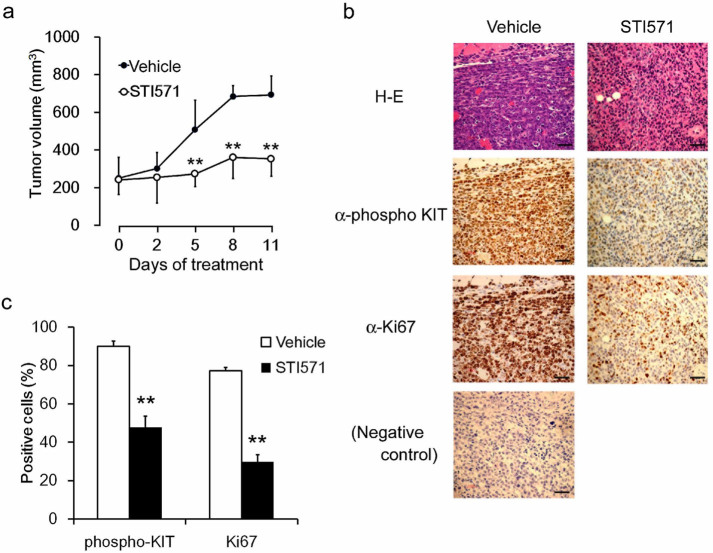
Figure 4. In vivo growth and STI571 sensitivity of IC-2N508I cells.
(a) growth curves of IC-2N508I cells in vivo. A total number of 5 × 10⁶ cells were injected subcutaneously into the flanks of BALB/c-nu/nu mice, and tumor sizes were measured every 2 or 3 days. STI571 (100 mg/kg) was administered orally daily, starting 10 days after tumor cell transplantations (Day 0 in the graph). Each data point represents the mean ± SD for 6 animals in each group. ** p > 0.01, compared to vehicle-treated mice. (b) immunohistochemical analysis of IC-2N508I cells. Tissues were collected on Day 11, and phospho-KIT and Ki-67 staining was conducted. Original magnification, × 200. Bar; 100 μm. (c) percentages of phospho-KIT- or Ki-67-positive cells are indicated as means ± SD obtained from 5 randomly selected microscopic fields. ** p > 0.01, compared to vehicle-treated.

