
Figure 1. Overall survival by cohort.
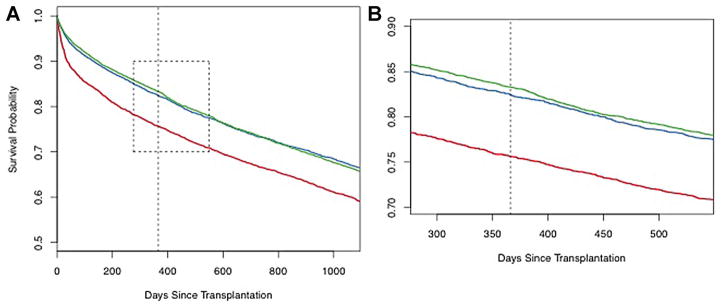
Kaplan–Meier survival curves for the three cohorts: historical control (1995–2000) (red line); pre-LAS (2001–4/2005) (blue line); and post-LAS (5/2005–6/2010) (green line). Panel A—full curves out to 1095 days; Panel B—expanded curves (area outlined in Panel A) centered on the 1-year time point (dashed black line) out to 1.5 years.