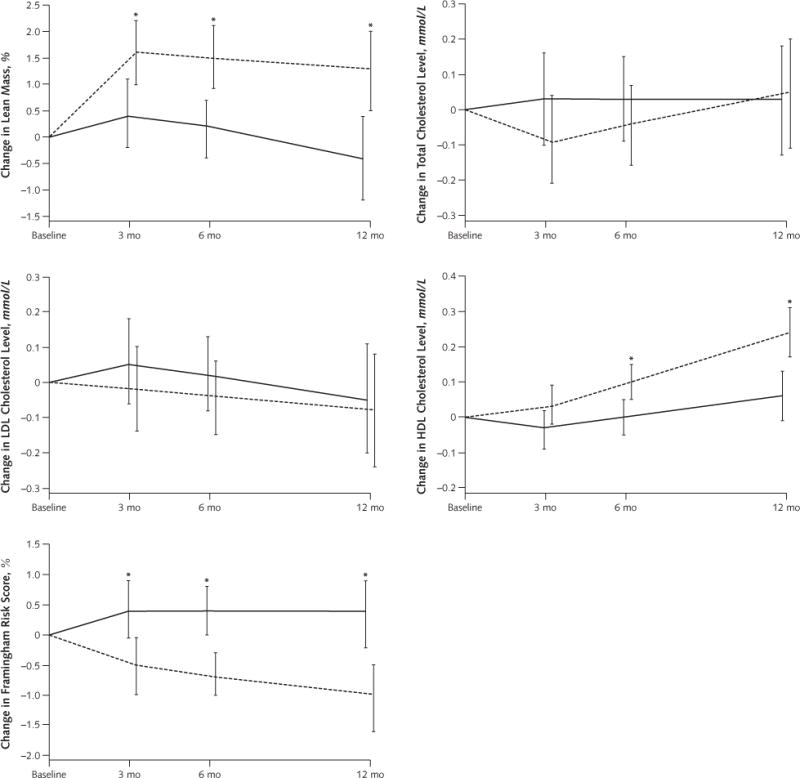
Appendix Figure.

Predicted mean changes in lean mass, total cholesterol level, LDL cholesterol level, HDL cholesterol level, and 10-y Framingham risk score in the low-fat and low-carbohydrate diet groups
Results are from random-effects models and are expressed as means, with error bars representing 95% CIs. To convert cholesterol values to mg/dL, divide by 0.0259. HDL = high-density lipoprotein; LDL = low-density lipoprotein.
* P < 0.05 for between-group difference.
