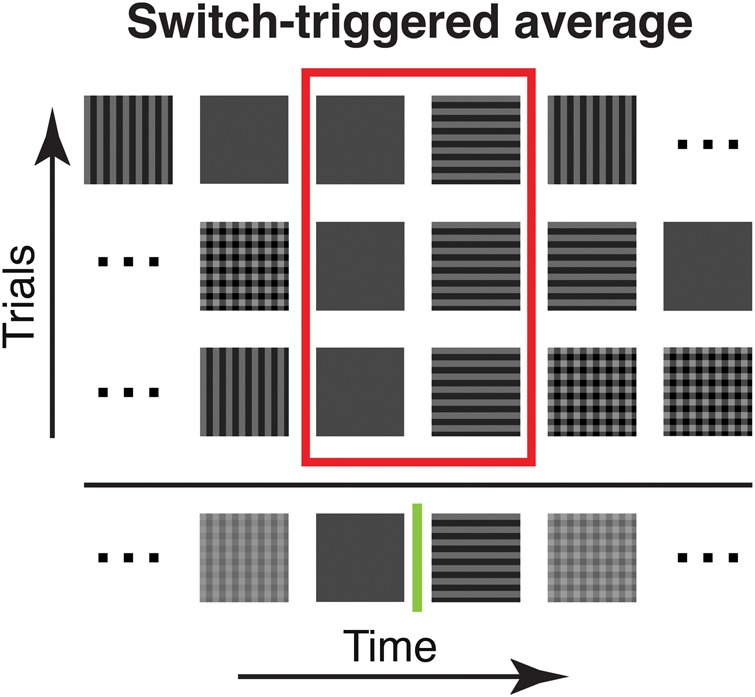
Figure 1.

Illustration of the switch-triggered average. Three pseudorandom stimulus sequences are exemplified (5 stimuli are shown; in the experiments we used at least 64 different sequences of at least 17 stimuli, see Materials and Methods). Sequences were aligned to a specific switch between a pair of stimuli (blank to horizontal in this example) to illustrate our averaging procedure. Note that when aligning sequences to a particular switch type for averaging, the stimuli before and after were different. For switch-triggered averaging, the procedure was used to average the cortical responses to a particular stimulus pair across all sequences shown.
