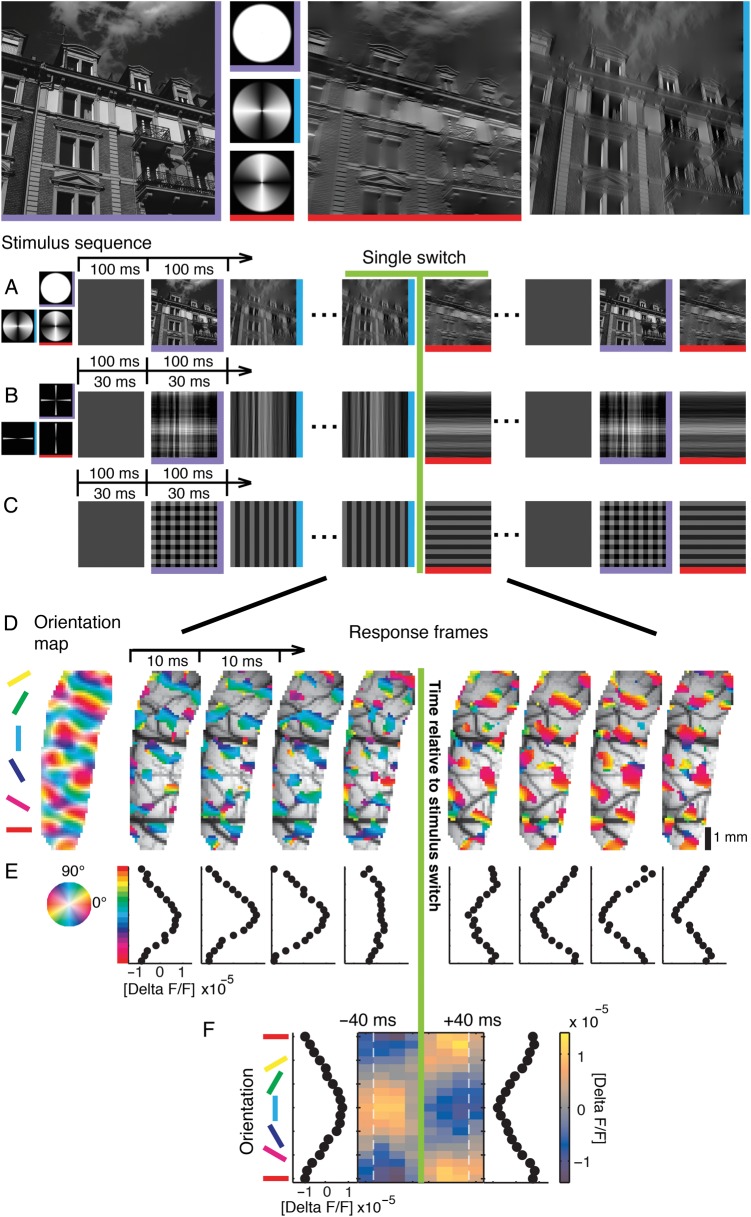
Figure 2.
Visual stimulation and cortical representation of oriented contours. Top: Example stimulus, a natural image (left, purple), and its horizontally (red) and vertically (blue) filtered versions using broad filters in Fourier space (second column). Here and in subsequent figures colored edges of stimulus icons indicate stimulus type (horizontal stimulus (H): red horizontal edge; vertical stimulus (V): blue vertical edge; superposition (VH): purple horizontal and vertical edges). (A–C) Time sequences of stimuli with different orientation content, presented either at 30- or 100-ms stimulus periods (see outlined arrows): broad filters (A), narrow filters (B), and square-wave grating (C). (D) Switch from a vertical to a horizontal square-wave grating (30-ms stimulus period): the most active 30% of pixels in each 10-ms camera frame are shown and overlaid on the vascular cortical image (averages over 384 switch repetitions). Here and in subsequent plots, data were shifted by 50 ms to account for average latency; the green line at zero marks relative time to switch. Pixel color denotes preferred orientation derived from a conventional orientation map (most left), which was recorded separately (see Materials and Methods). (E) Population tuning curves for each time frame obtained by averaging activities over pixels with the same orientation preference (preferences were binned into 18 classes of 10°). Horizontal orientation bin (0°, red) is displayed twice. Abscissa shows amplitudes of tuned activity (ΔF/F, see Materials and Methods). (F) Switch-triggered average as compact illustration of the data in E. Colorbar shows amplitudes of tuned activity. Orientation tuning curves to the left and right of the central frame illustrate time averages (−40 to 0, and 0 to +40 ms). Dashed faint lines illustrate time shifted (50 ms) positions of transitions from and to other stimuli (before and after the switch), which were averaged across all sequences by switch-triggered averaging (see Fig. 1 and Materials and Methods).

