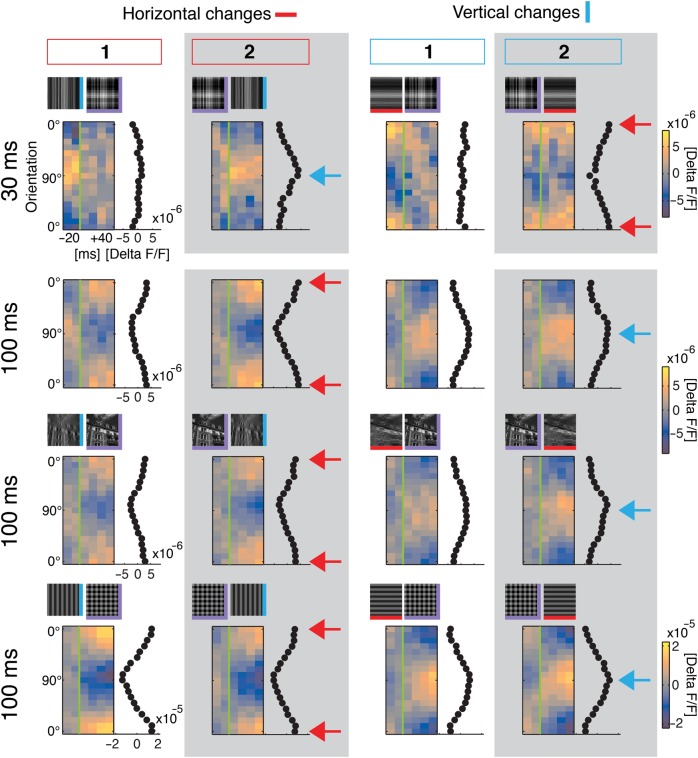
Figure 4.
Primary visual cortex represents difference in orientation content compared with past. Conventions and layout as in Figure 3 columns #1 and #2. First row is for comparison with short 30-ms stimulus period: Responses to narrow filtered natural stimuli, 1 experiment (384 switch repetitions, V/H to VH: P > 0.99 no tuning; VH to V: P < 0.01 tuned [residual P = 0.99]; VH to H: P < 0.02 tuned [res. P = 0.88]). Bottom rows: 100-ms stimulus period, narrowly filtered natural stimuli (second row; average modulation depth: 0.6 ± 0.2 ×10⁻⁵), broadly filtered (third row; average modulation depth: 0.5 ± 0.1 × 10⁻⁵), and gratings (last row; average modulation depth: 2.1 × 10⁻⁵). Blue arrows highlight positions of vertical tuning (90°), and red arrows indicate horizontal position (0°). Note that tuning peaked around removed (or added) orientations instead of currently presented orientations (for narrowly and broadly filtered stimuli, all displayed switches: P < 0.001 tuned [residuals: P > 0.99], 12 experiments [256–896 switch repetitions each], average is shown; for gratings, all displayed switches: P < 0.001 tuned [res.: V to VH: P = 0.96, VH to V: P = 0.69, H to VH: P = 0.65, VH to H: P > 0.99], 1 experiment, 236 switch repetitions).

