Figure 5.
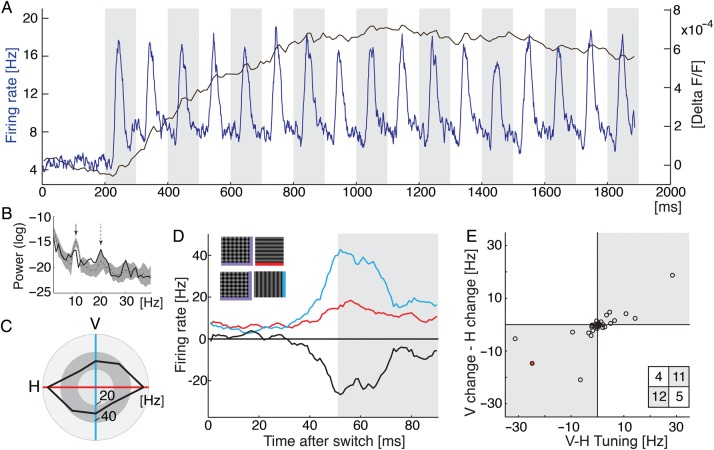
Electrophysiological recordings. (A) Multiunit activity (MUA) versus optical signal. Blue trace shows averages over 32 recordings (4 different hemispheres) and over randomized 10-Hz sequences of gratings. Black trace outlines the time course of the unfiltered optical signal (average over space and all 10-Hz sequences, 1 experiment). (B) Log power spectrum of the evoked dye signal (in the steady phase 900–1900 ms). Spectrum of trace in A (black bold line) and the log spectra for filtered natural stimuli of all 12 experiments (narrowly filtered stimuli, gray dotted line shows mean, shaded area shows std). First arrow points to stimulus frequency (10 Hz), the dotted arrow indicates first harmonic (20 Hz). (C) Example spike recording. Spike responses to moving gratings of four different orientations (temporal average over 800 ms) indicating orientation tuning to horizontal (red axis). (D) Responses to either horizontal (red) or vertical (blue) orientation after presentation of their superposition, black trace plots difference. (E) Summary: Differences between responses to vertical and horizontal moving gratings (i.e., orientation tuning, cf. black outline in C) are plotted against differences in responses to vertical and horizontal after presentation of their superposition (cf. black trace in D). Time averages across the same time window as used for the imaging data (see gray shading in D). Each circle plots MUA (n = 32, red dot represents example shown in C, D). Spike responses tend to be higher after the preferred orientation was switched-off from the superposition (gray shaded quadrants) than when it was the remaining orientation; Fisher's exact test one-tailed P = 0.016; inset shows count for each quadrant.

