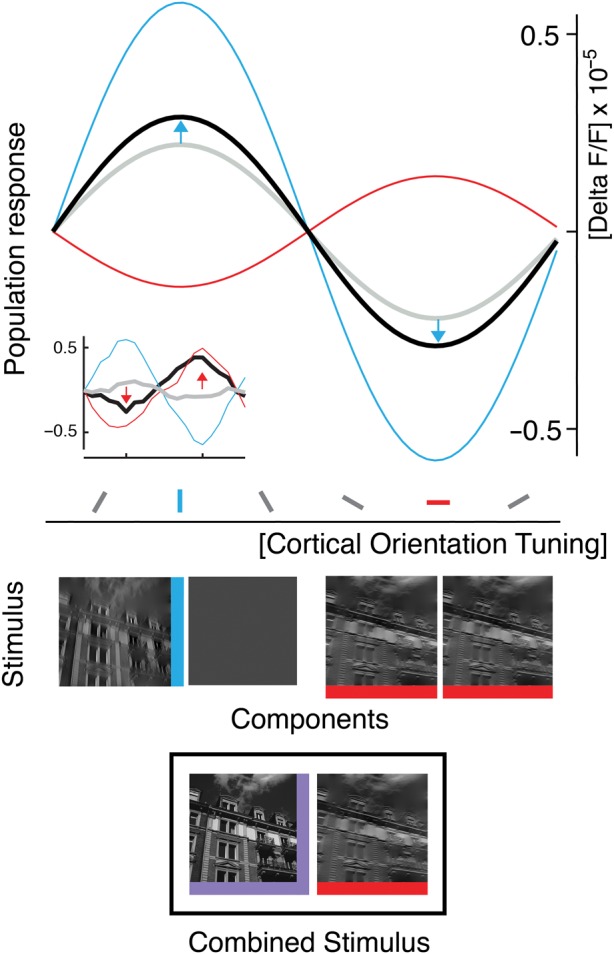
Figure 7.

Disentangling components that produce change coding within 10-Hz sequences. Schematic of the response to a switch from superimposed orientations to a single orientation (bottom icon, black box) and the responses to the constituents of this switch (middle icons): Median of fitted population tuning curves (see Materials and Methods and Results) for off-component (blue), adaptive component (red), and composite switch (black; n = 48, medians across 12 experiments, both orientations, and both filter conditions of the natural images). Note the blue arrows, indicating deviations from the component average (gray, see main text for quantification). Overall, the measured response to the combined stimulus represents the difference between the past stimulus (i.e., superposition, purple icon at bottom) and the current orientation (horizontal, red icon at bottom). This difference is the orientation that was turned off (see peak of black curve at position of vertical orientation tuning, blue). The opposite result was found for 30-Hz sequences (see example in inset; nonfitted data of an experiment obtained with narrowly filtered natural images).
