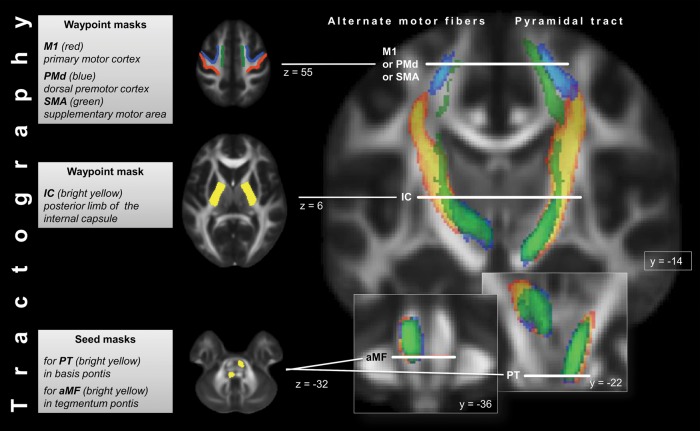
Figure 1.
Schematic overview of masks used for tractography as well as of course of reconstructed canonical PT (right side) and aMF (left side) as they descend from the motor cortex to the pons. To generate the canonical images, individual tracts from all subjects were normalized, converted to binary images, and then summed. Cortical contributions from the 3 following cortical areas to PT and aMF are displayed in different colors: red-yellow = contribution from M1 to PT/aMF; blue = contribution from PMd to PT/aMF; green = contribution from SMA to PT/aMF. Color brightness indicates the degree of voxel-by-voxel overlap of the individual normalized tracts. Tractography masks are described in charts on the left side of the figure. “y” and “z” indicate slice position along y- and z-axis in MNI space.

