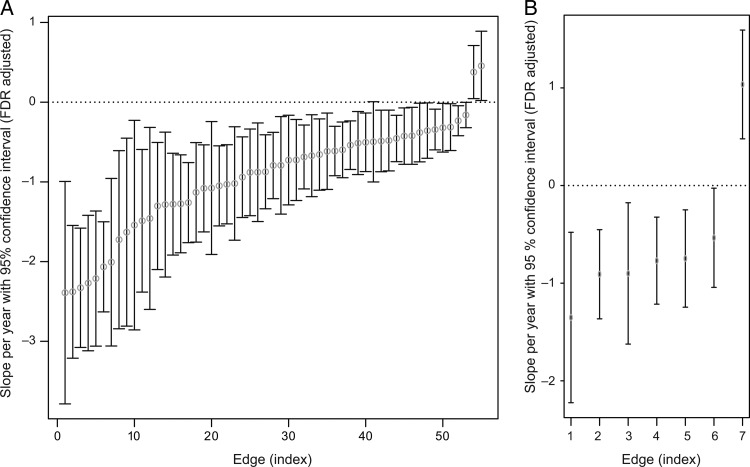
Figure 6.
Individual edge slopes representing age effect per year with FDR-adjusted confidence intervals. (A) Individual edge age effect for both genders. x-axis: indices of edges, y-axis: coefficients for age effect per year with FDR-adjusted confidence intervals. The last 2 edges with positive slopes and confidence interval ranges are the edges with an increased streamline count and the others are the fiber tracts characterized by a decreased number of streamlines. (B) Age-related sex effect. x-axis: indices of edges, First 4 edges show decreasing rate of streamline count for females and the rest 3 edges displays age effect for males, y-axis: coefficients for age effect per year with FDR-adjusted confidence intervals.

