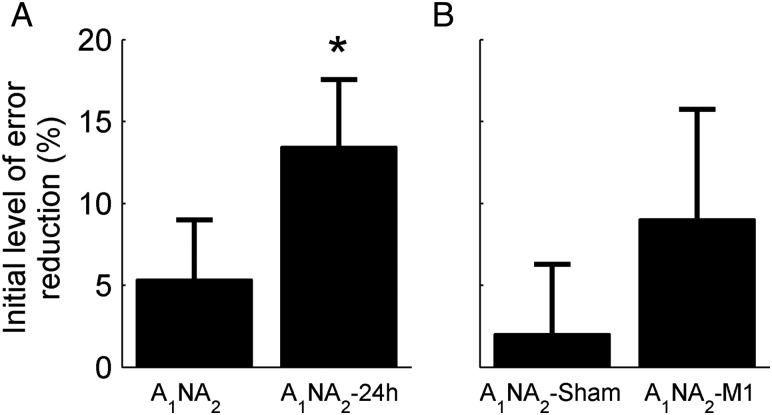
Figure 3.
Initial level of error reduction. Shown is the mean ± SE percent reduction in the initial visuomotor error (first cycle) across learning sessions for Experiment 1 (A) and Experiment 2 (B). Only the experimental group of Experiment 1 (A1NA2-24 h) showed a significant increment in the initial level of error reduction as indicated by an asterisk (*P < 0.01).

