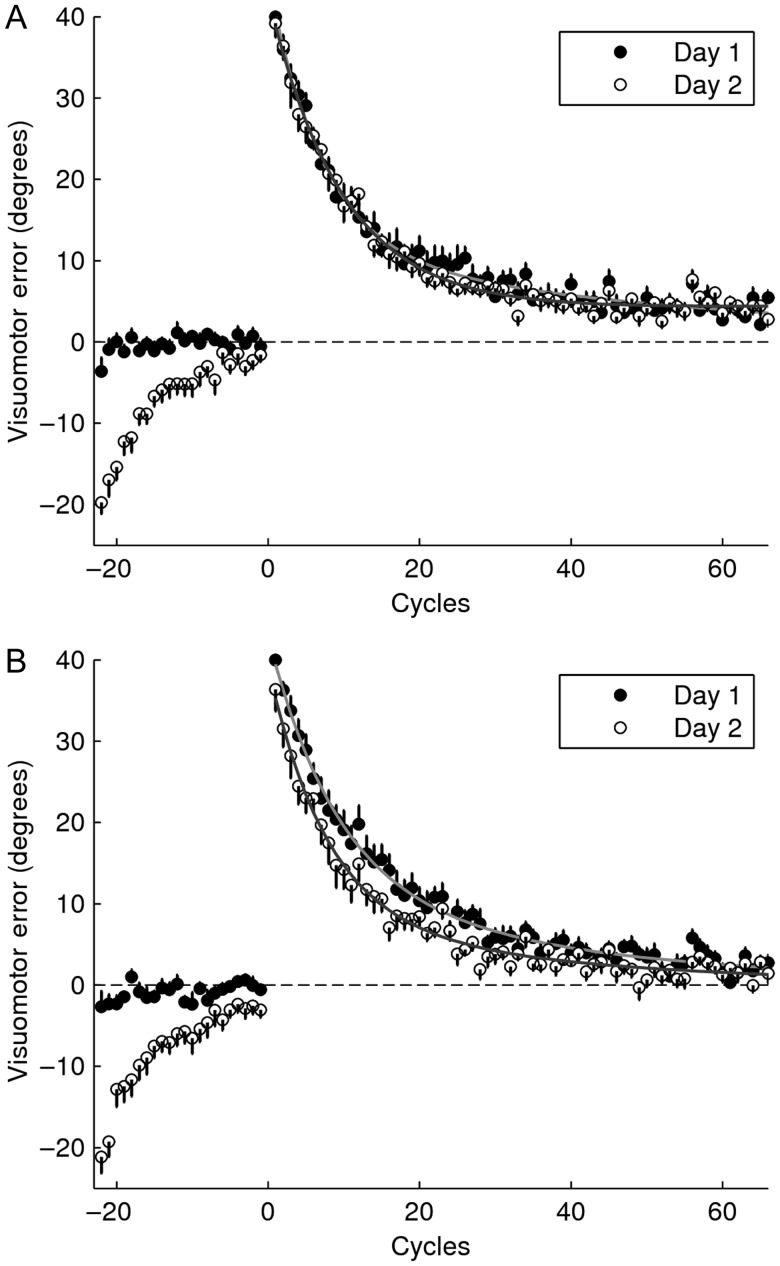
Figure 6.
Learning curves for Experiment 2. Mean visuomotor error ± SE are shown as a function of cycle (1 cycle = average of 8 trials) for the adaptation and re-adaptation sessions. (A) A1NA2-sham, (B) A1NA2-M1. The curves resulting from fitting the data with a double exponential function are displayed for the adaptation and re-adaptation sessions.

