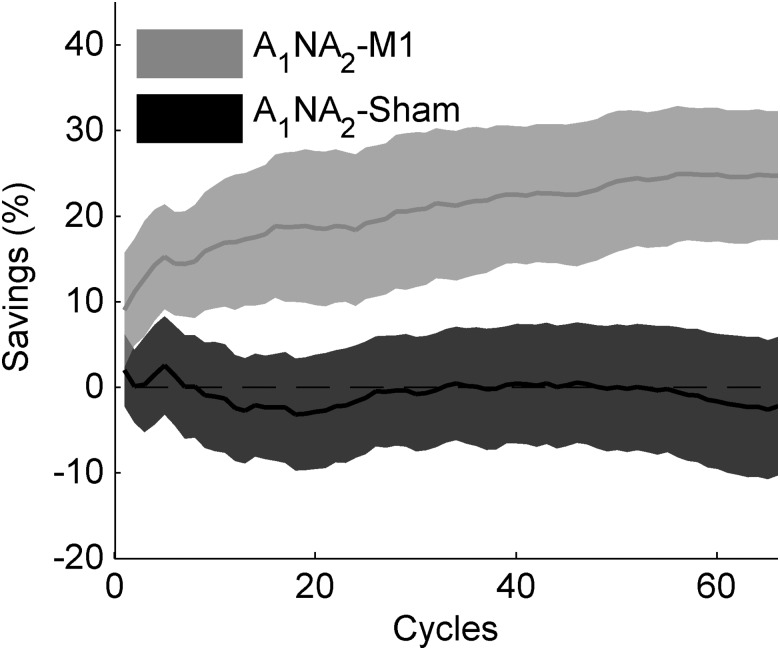
Figure 7.
Progression of Savings as a function of cycle for Experiment 2. (A) Savings (S) was computed as the cumulative percent increment in learning from adaptation, according to equation 2. Shown are the mean ± SE of S for each cycle of the experimental (A1NA2-M1) and the control (A1NA2-Sham) group.

